Urea clearance in the presence of BSA in PBS
In this experiment I use a syringe pump to move urea dissolved in ddH2O through a 10 mm long, 300 µm high, 500 µm wide dialysis channel. The retentate is collected in a fraction collector then measured using a urea assay from Abcam.
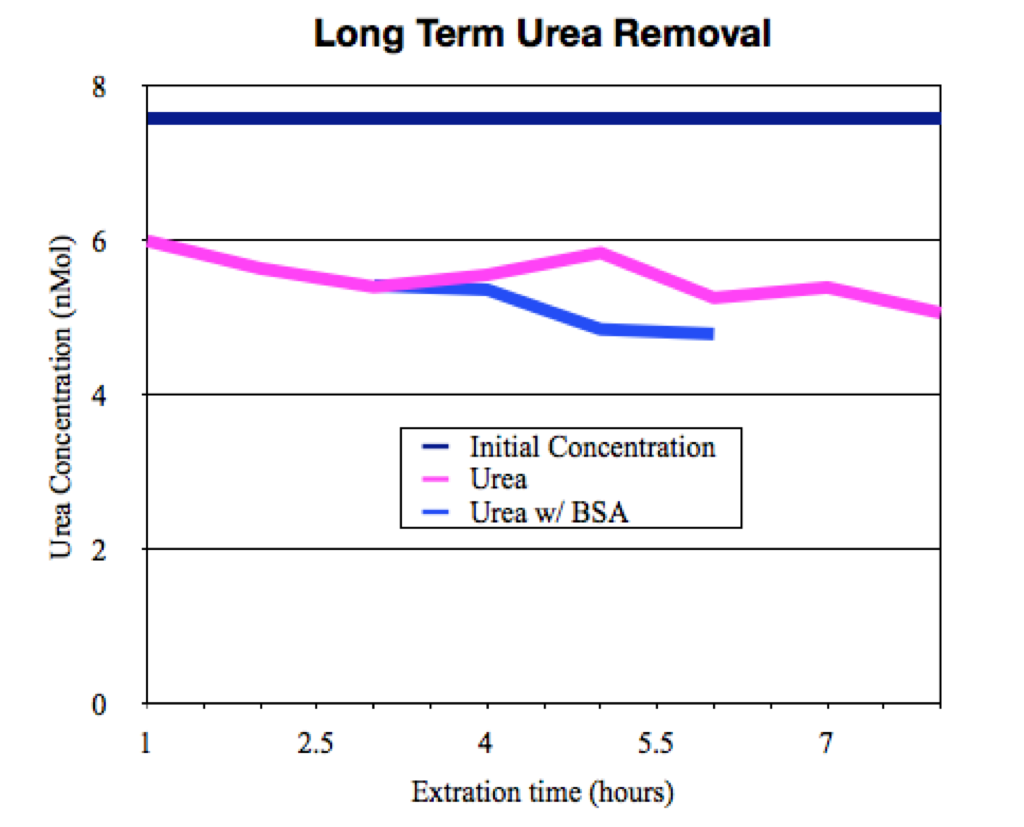
Our first experiment on Urea clearance with BSA was performed with 0.5 mM Urea and 0.5 mg/mL in ddH2O. The results are shown below along with the long term Urea clearance data (without BSA). In the absence of salt, the BSA has no effect on the Urea clearance. Interestingly the slight improvement of urea removal after four or five hours is evident in both experiments. It has been postulated that this could be due to the urea effectively ‘wetting’ the pores allowing the following urea molecules to slide through the pores with less steric and frictional hindrance.
The BSA in these experiments was dissolved in ddH2O. Future experiments will be performed using PBS. While this may amielerate the charge issue expressed above, it may introduce the problem of membrane integrity in the presence of salt.
I’ve added 2D modeling data to the graph. The top line is the modeling results for the geometry used experimentally and has been fitted to the collected data. 10-cm long channel, 300-µm tall, 5.6 µL/min. For this set-up, the velocity of the fluid is 6.3×10⁻⁴ m/s. The urea concentration, Cu is 4.929 nMol. The next line down, Cu = 4.1568, is predicted for a 100-µm high channel flowing at the same flow rate of 5.6 µL/min and a velocity, V = 1.9×10⁻³ m/s. If we keep the flow velocity constant, V = 6.3×10⁻⁴ m/s, then the model predicts the bottom line, Cu = 1.15 nMol.
Evaluating these by the instantaneous clearance, K = ER*Q, where ER is the extraction ratio and Q is the volumetric flow rate…
1. ER = 1 – 4.929/7.6 = 0.35
Q = 5.6 µL/min
K = 1.97 µL/min
2. ER = 1 – 4.1568/7.6 = 0.45
Q = 5.6 µL/min
K = 2.54 µL/min
3. ER = 1 – 1.15779/7.6 = 0.85
Q = 1.87 µL/min
K = 1.59 µL/min
What this tells us is that if you reduce the channel height while maintaining the volumetric flow rate, you will see modest improvements in the instantaneous clearance due to the decreased residency time, TR. If, on the other hand, you try to maintain the average flow velocity, K will be lower due to the much reduced volumetric flow.
In summary, shallow channels do not improve the instantaneous clearance, K, of the device. There may be other reasons to do this (e.g. lower ex vivo blood volumes) but it will not help to improve clearance.
Also of note is that for a given height, h = 100 µm, the clearance K is improved by increasing the flow rate, Q. This is somewhat counter intuitive as the residency time, TR, obviously decreases with increased fluid velocity which will lower the extraction ratio, ER. However, as K is calculated from the product of ER and Q and the simulation numbers in the graph show that the volumetric flow rate dominates.
Can we add two theoretical curves to the figure in this post? The first would be the simulation that best matches the result with 300 micron wells, the second would be the prediction for 100 micron wells.
Can you show – in a separate post – that there is an optimum channel height that achieves maximum clearance for a fixed volumetric flow rate?
With only 13 channels per chip we are below 100 ul clearance per chip right now. We are going to need to do better than this.