Take Two: n-Dodecyl β-D-Maltoside Coating on PDMS
Now that I’ve got plenty of fluorescent protein, I’ve moved back to testing protein adsorption to various surfaces. I’ve repeated the n-Dodecyl β-D-Maltoside (“DDM”) coating procedure (reference) with the goal of preventing or heavily decreasing the protein adsorption to the PDMS surface.
This time I had a total of four samples: DDM treated, sham treated, untreated, and no protein. Excluding the no protein case (which was simply cut from a PDMS sheet, stuck onto a glass slide, rinsed with DI water, and then put under the fluorescence microscope,) the samples were placed in individual petri dishes and rinsed with DI water. The DDM sample was submerged in DHBS (0.1% DDM in HBS) for five minutes and the sham sample was submerged in an equal volume of HBS for the same duration. Then, all three samples were again rinsed with DI water — this step is helpful in that it removes the HBS and DHBS from the petri dishes, but potentially crucial for the DDM case as the reference notes that rinsing after incubation is essential in creating a stable DDM coating. Finally, all three samples were placed into a single petri dish which was then filled with 6mg/mL TRITC conjugate BSA to the point of submerging the samples. The protein was left to incubate on the surfaces for one hour. The protein solution was then poured out and the samples were rinsed with DI water for a third time and dried with nitrogen. The samples were placed onto a glass slide and their fluorescence was measured immediately after.
The ‘no protein’ case acts as a negative control whereas a positive control is established by previous tests showing that pure protein saturates the fluorescence microscope (returns the fluorescence value ‘4095’). The entire surface of the samples were scanned and several images taken at various locations. Taking images at arbitrary and randomly distributed locations across the samples, the results of the fluorescence measurements were as following:
| Average Fluorescence | Scaled | Standard Deviation | |
| DDM | 705.0 | 5.38 | 65.8 |
| Sham | 1035 | 7.89 | 81.3 |
| Untreated | 874.7 | 6.67 | 53.4 |
| No Protein | 131.1 | 1 | 21.2 |
Scaled values are given with the no protein sample used as a background. They are taken by dividing the average fluorescence by background (so that, for example, the Sham sample’s average fluorescence is 7.89 times as much as background.) Values were pretty even across the surfaces, as evidenced by the relatively low standard deviations.
One interesting and important detail is that the Sham sample had one small region that was absolutely covered by adsorbed protein. An image taken in DIC mode is provided:
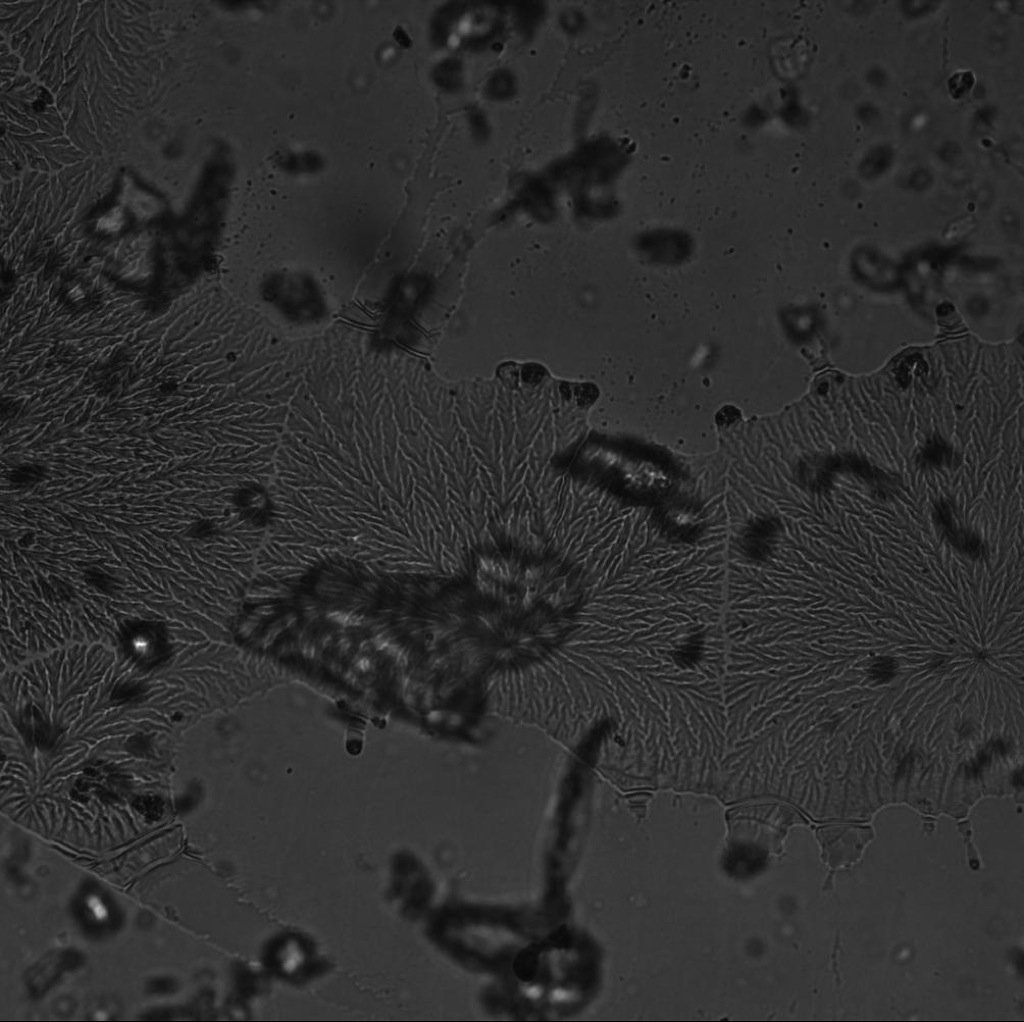
This crystal pattern is indicative of BSA dried on a surface. Under the rhodamine lamp, this region of the sample lights up for a fluorescence measurement of 3371 — 25.7 times more than background.
If I had found this type of adsorption on the surface of the untreated sample as well, or simply had found more examples of it on the sham treated sample, the results would be pretty blatant. Unfortunately, this was not the case, so while the DDM treatment seems to have been somewhat helpful, it’s impossible to say just yet if it will prevent this kind of adsorption while untreated PDMS adsorbs more regularly.
I’m still a bit stingy with the fluorescent protein simply because it takes a fair amount of time and effort to produce it, but in retrospect it might’ve been foolish to incubate all three samples in the same petri dish. The DDM on the surface of the DDM sample may have come off and into solution with the protein, where it would be free to bind to the other PDMS surfaces which were supposedly untreated with DDM. Also, I will want to test how these results compare with higher concentrations of DDM in the DHBS solution — as Jim put it, “if this is good, maybe more is better.”
I’ll continue with this tomorrow and maybe make an update or another post. For now, at least the coating seems to be doing something!! The great glacier of scientific progress moves forward infinitesimally this day.
UPDATE: Today I repeated the test with a couple slight tweaks. This time, my three samples were 0.1% DDM, 1% DDM, and sham, and each sample was incubated with protein in its own petri dish. Results are a little puzzling:
| Average Fluorescence | Standard Deviation | |
| 0.1% DDM | 598.7 | 28.0 |
| 1.0% DDM | 650.7 | 38.2 |
| Sham | 646.8 | 35.7 |
As I was taught to do in introductory biochemistry, I can come up with a scientifically defensible explanation for this, but I have no evidence for it (that’s an A on a BIO 110 test…!) The high concentration of DDM may increase the number of DDM particles bound to the PDMS surface at equilibrium, and that number might be high enough that DDM particles are unable to form a stable coating due to interactions with other DDM particles on the surface. After all, DDM is comprised of a hydrophilic head and a hydrophobic tail, so it’s conceivable that at high concentrations it could be more energetically favorable for DDM particles grouped together at the PDMS surface to form micelles than to stay bound to the surface. Lower concentrations might be less likely to form micelles because it’s less likely for sufficiently large quantities of DDM particles to be close together on the PDMS surface.
According to Thermo Scientific, the critical micelle concentration for DDM in 0.2M NaCl (which is very similar to the Hepes Buffered Saline solution this reaction with PDMS is intended to take place in) is 0.006% mass/volume. Thus, even the 0.1% solution is definitely forming micelles and perhaps this is interrupting the surface bonding. Perhaps it’s worthwhile to test the effectiveness of lower concentrations of DDM, but this doesn’t explain why the reference got such good results with the 0.1% solution.
In any event, results are still a bit underwhelming. The 0.1% DDM treatment certainly appears to have some effect with a decent amount of consistency, but it’s hardly anything to speak of. These results are nowhere near as dramatic as those reported in the reference paper, even in the worst case (pipette flushing,) which leads me to believe I’m doing something wrong. I’ll be thinking on this and looking into what modifications I can make to the process to more closely approach that described in the reference. I’ll do some reading on the theory behind the surface adsorption of DDM to PDMS, and check that all my steps should work as intended. Perhaps it’s something as simple as changing the pH of my buffer to promote the adsorption — who knows!
UPDATE 2: The reference paper references another paper (who knew?) which reports a study on the adsorption of DDM to various surfaces, including graphite, which is hydrophobic (just like PDMS.) The results are interesting, but the most important thing I took away was this graph:
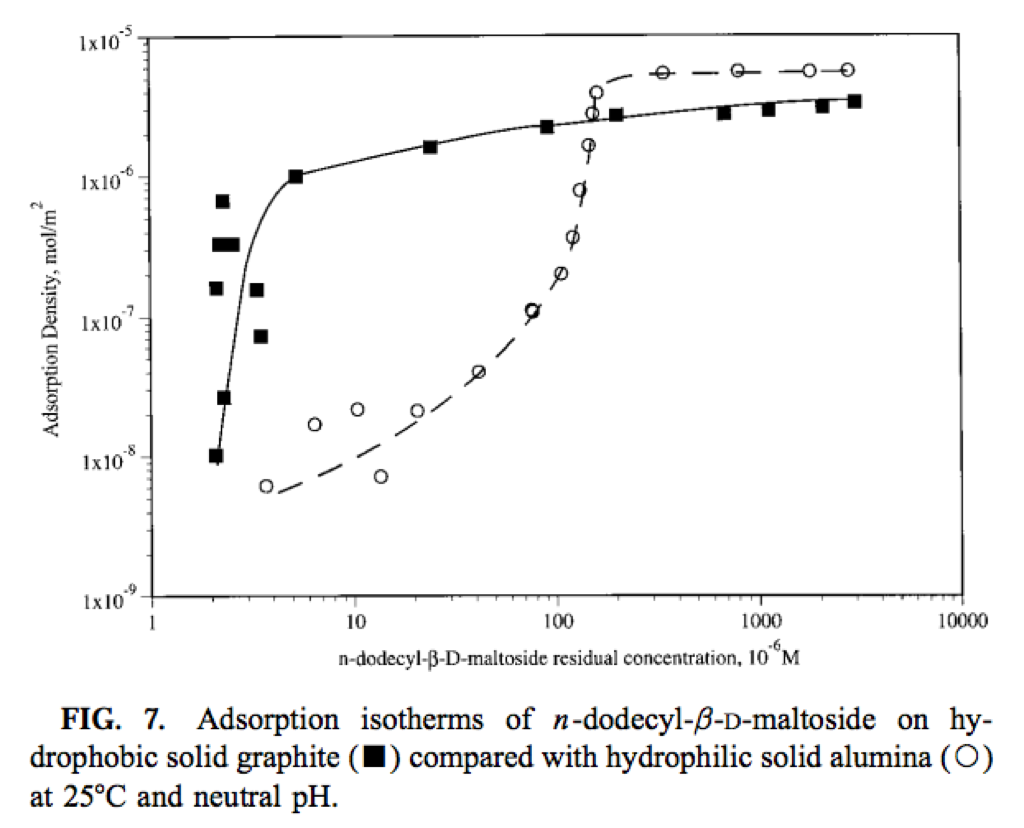
(Citation: L. Zhang, P. Somasundaran and C. Maltesh, J. Colloid Interface Sci., 1997, 191, 202–208. Link.)
According to this graph, the coating begins to plateau in DDM particle density at about 0.01mM, a concentration two orders of magnitude lower than the critical micelle concentration reported by Thermo Scientific (0.12mM.) I have no idea why the reference decided to use 200mM DDM in spite of the critical micelle concentration being between those two values, but I suppose it shouldn’t hurt because the graph does not display a decrease in coating effectiveness at the critical micelle concentration. It does appear to have an effect on hydrophilic surfaces, but that should be neither here nor there in the case of PDMS.
This paper also uses much longer DDM incubation times — while the reference (and thus my experiments) include an incubation with DDM on the PDMS surface for just five minutes, this paper incubates all of its samples in DDM for 16 hours. I can see no reason that longer incubation times should be detrimental, so I’ll toy with this if necessary.
This paper encourages me to look into the effectiveness of lower concentrations of DDM, but still doesn’t explain the reference’s success against my failure.