Rotation Summary: A study on neutrophil migration through collagen coated nanoporous membrane
This post serves as a summary of the work done during my rotation in the McGrath lab this summer. Over the course of six weeks, I shadowed projects covered in the lab along with the specializations of microfluidic devices and porous membranes. I worked closely with Tejas, who gave me a glimpse of his work with neutrophils and their migration through a nanoporous membrane and endothelial cells. I have summarized my experience in the lab into the six weeks and the tasks that were accomplished each week. The work culminated with an analysis of fluorescence experiments aimed to understand the migration of the neutrophils through the membrane in the presence and absence of collagen.
Week 1: Introduction to device building and familiarity with the purpose of the device in the lab setting.
In this stage, the manufacturing of devices was observed and practiced. Starting from the design stage of the Silhouette Studio program to practicing seeding and imaging on devices. One important aspect of this stage was understanding the importance of materials used to build the devices and the attention to detail required when working in such small dimensions. Any imperfections in this stage of device building can result in the loss of multiple experiments. Since the devices are designed to simulate physiological conditions, the materials used have multiple qualities that mimic these conditions. The materials used in the building of the devices are Polydimethylsiloxane-diacrylamide (PDMS), 300M tape, and 100-300 micron gasket. In the case of PDMS, its malleability and high oxygen diffusivity characteristics provide the desired environment for HUVEC growth while containing optical properties that allow image capture (A, 2005).
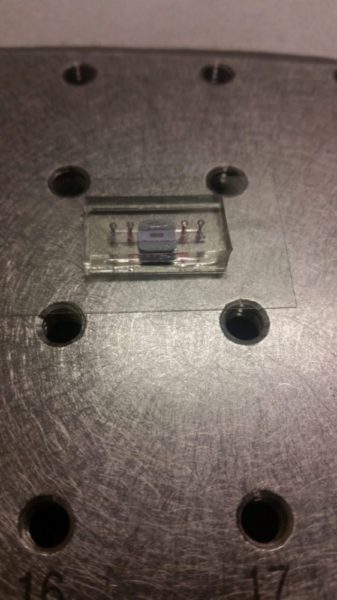
Figure 1: 2-chamber device
The silicon chips are the center for any device produced in the lab. These porous membranes allow for the study of permeability in biological membranes among other applications. The chip can be altered by changing its porosity from nano-porous to micro-porous to alter the permeability of molecules of different sizes. These options allow for devices to be manufactured in many designs specific for a purpose. Various collaborations have risen because of this aspect, opening a window for research not specific to this lab. My experience with the chips was focused on correct handling techniques along with the orientation of the chip.
Week 1 + Week 2: HUVEC cell culturing
Parallel to working directly with the devices there was exposure to the importance of cell culture. Including the work with HUVECs in the devices. Starting with aseptic techniques required when handling the cells to the differences in the medium required to grow them. The endothelial cell base growth media contains the necessary elements to keep the cells healthy for the experiments. The cells can be kept in regular and serum-free media which allows the cells to be more receptive to changes in the environment. Serum-free media was used for the neutrophil experiments discussed later.
The devices permit cells to be either in static or flow conditions which lead to distinct characteristics in the cells. In the presence of shear stress, flow conditions, the cells tend to change phenotypically and functionally, mimicking physiological conditions closely. The flow system was designed to operate at low flow rates and continuous flow. Since the devices are delicate, the operation of the flow system must be done carefully and often requires some troubleshooting to prevent leaks or damage to the cells in the device.
Week 3 + Week 4: Neutrophil Isolation, flow set-up, and some manufacturing/troubleshooting, microscope calibration on Zeiss and Nikon, and importance of baseline for photobleaching in fluorescent microscopy.
Neutrophils are used to test the permeability of the endothelial cell membrane on the devices. The neutrophils are isolated from human blood samples and last approximately 12 hours until they are no longer viable for experiments. This isolation is particularly important and requires diligent aseptic technique and careful handling. From the isolation, a population of 5-10 million cells is acquired. This count is obtained by counting the neutrophils using a hemocytometer and using a formula to average the number of cells. Figure 2 shows the hemocytometer grid. The cells are counted on the left side by adding the number of cells in the red boxes. The right side is counted by adding the number of cells in the green boxes. The two sides are then averaged and multiplied by 2500 and then multiplied by 20 to get the population of cells in the sample.
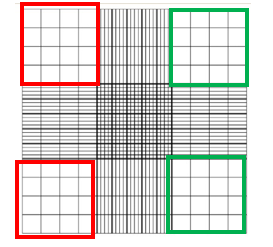
Figure 2: Hemocytometer grid, photo from microbehunter.com
The isolation is diluted or concentrated to yield a 10 million cell count that is introduced into the devices. The neutrophils are introduced into the device with fitc dextran to trace their migration through the HUVEC membrane. After 45 minutes of fluorescent tracking, the device is analyzed to see neutrophil migration to the bottom channel of the device. Through this analysis of the bottom chamber, the permeability of the cell membrane can be assessed.
Permeability Assay (tecan)
The first permeability assay analyzed neutrophil migration through a tecan scan detecting fluorescence and therefore acquiring a concentration of neutrophils. Initially, the neutrophils were introduced into the device and incubated for 30 minutes at 37C. A 10 µl sample was taken from the bottom chamber of the device and analyzed in the reader. A ladder was developed in which concentrations of fitc dextran, ranging from 0.2 – 0.032, were used to track the fluorescence values of the neutrophil samples. After a handful of experiments, the values collected from each trial did not correlate to each other nor to the ladder developed. It was difficult to determine the meaning of the value expressed by the reader for each sample since a comparison was not well defined. Unfortunately, this assay did not produce reliable results and therefore was not pursued further to quantify neutrophil migration through the membrane.
Due to the challenges presented by the permeability assay using the Tecan, a fluorescent imaging assay was used to analyze neutrophil migration across the membrane. This assay consisted of tracking the fluorescence of the inactive area on the device using a Nikon TS100 microscope and a Matlab image capturing program. An image was taken every minute for a total of 45 minutes. Figure 3 shows the experiment layout and images of fluorescence as time progressed. By tracing the intensity of fluorescence in the device, it can be concluded that the neutrophils traveled through the membrane in a similar way. The average intensity of each image was obtained and graphed against time. This analysis monitors the migration of FITC-dextran and neutrophils across the membrane. To further quantify the results obtained from this assay it was important to obtain some control experiments that define the maximum and minimum amount of permeability through the membrane. These were obtained by performing an experiment with thrombin to obtain the maximum permeability and an experiment with only cells present to obtain the minimum permeability.
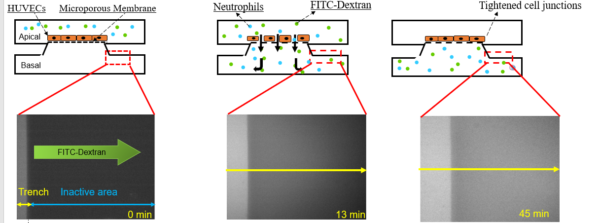
Figure 3: Neutrophil migration schematic
Although not indicated on the figure, 10 µl of rat tail collagen gel was placed on the chip membrane for HUVEC support. The addition of the gel provides a matrix in which the cells can firmly attach to and not be washed away during flow conditions. Each device was placed under flow conditions in this assay. Four neutrophil migration experiments were acquired and analyzed using a Matlab program. Figure 4 shows the shape of the curves depicting time on the x-axis and normalized intensity on the y-axis. These curves were acquired by plotting the row average of each image and normalizing the curve to the first value on the curve. The trend noticed in these curves increase until peaking at their maximum and then continue to drop until they plateau.
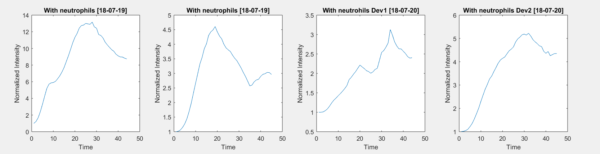
Figure 4: Neutrophil Curves
The same assay was performed with a device containing no cells nor neutrophils, only collagen gel and a device containing only cells and collagen gel but no neutrophils. Their curves can be seen in figure 5. Unlike the neutrophil experiments, the curves in both experiments increase steadily until reaching an equilibrium and do not decrease once it is reached. Unlike the neutrophil experiments, there is no maximum peak present in these trials.
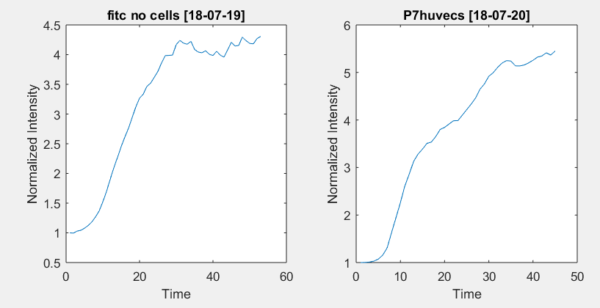
Figure 5: Left, no cells present and right only cells and collagen gel present
Introducing thrombin into the device disrupts the endothelial cell junctions. This disruption opens the cell junctions and allows for enhanced permeability. Three thrombin experiments were done, and their curves can be seen in figure 6. Similarly, to the cell and collagen assay, the thrombin control curve increased without peaking at a maximum, yet a small plateau is present in the first 20 minutes. This slower increase period may be due to the cell junctions being disrupted and the later increase when all junctions are opened.

Figure 6: Thrombin control 1
Due to the periodic fluorescence excitation to the sample in this assay bleaching was a concern. Photobleaching occurs in fluorescence microscopy where there is a loss of photons upon illumination of a sample, this loss accumulates with every illumination and can cause errors in results (Photobleaching Principles, 2016). To account for photobleaching it was necessary to develop a photobleaching correction curve to determine the loss of fluorescence throughout the experiments. This was accomplished by introducing 1 mg/ml solution into a device and monitoring the decay of fluorescence over 10 minutes. This same concentration was used in the fluorescence assay. An error correction formula was used to analyze the deviation expressed by the collected values due to photobleaching. These photobleaching experiments were conducted using a glass slide and a coverslip with the fitc dextran solution in between. The sample was excited with fluorescence every minute for a total of 10 minutes and left untouched until 45 minutes where it was excited again. The intensity value at time 45 is in formula 1 where is the corrected fluorescence (McGrath, 1998).
![]() (1)
(1)
From the decay curve, a time constant was obtained. This time constant gives the time required for approximately 63% of decay to occur. By knowing the time constant a decay rate can be established for this concentration of dextran.
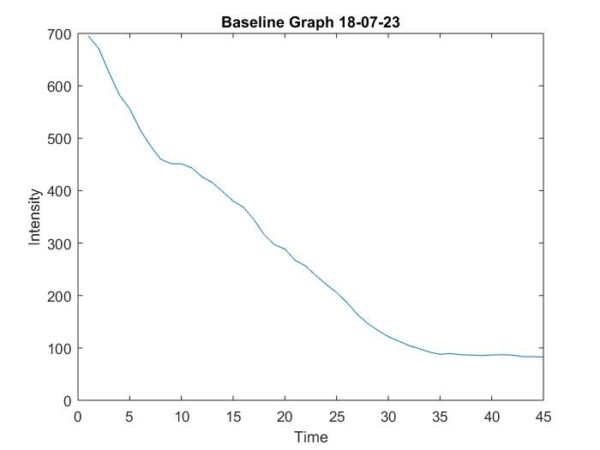
Figure 7: Baseline Curve after 45 minutes
The rate constant found from these curves was large (~8 minutes) indicating that fluorescent photobleaching in the sample did not skew the raw values greatly. The large tau value indicates that photobleaching contribution between two excitation times is insignificant (0.01). It is important to note that the samples were acquired over a 45-minute time frame, yet a trend could be determined by using the initial 5-10 minutes of the data. The outcome of this photobleaching correction experiment is that error due to photobleaching can be ignored in the experiments because the time constant for which is large enough to not make a significant impact.
During this time, a connection of the flow system to the devices was covered. This consisted of using a peristaltic pump, capacitor, reservoir, and plastic tubing to create a circuit that allowed cell media to flow laterally to the cells. The application of shear stress induces a phenotypic change in the endothelial cells that causes them to elongate and spread into a uniform membrane. Troubleshooting of this system requires careful monitoring of the system along with periodic changes of system pieces and media replenishing.
Week 5 and 6:
To fully analyze the neutrophil experiments, it was important to develop appropriate control experiments. These experiments were:
- Device with no cells or collagen gel
- Device with only collagen gel
- Device with collagen gel and cells under static conditions
- Device with collagen gel and cells under flow conditions
- Device with collagen gel and cells with thrombin introduced
These controls were necessary to understand how neutrophils travel through the membranes in the device. The second aspect of this experiment was to test the assay with antibody CD29 which should suppress the migration of the neutrophils through the cell membrane. Four experiments were performed using this antibody and can be seen in figure 8. Although each curve does not seem to have a specific trend it can be concluded that they seem less complex than curves with neutrophils and no antibody as can be appreciated in figure 9.

Figure 8: Neutrophil and Antibody CD29
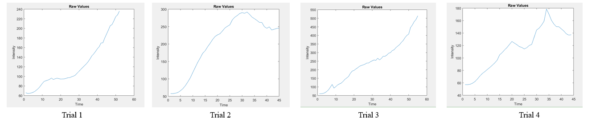
Figure 9: Neutrophils with no antibody CD29 present
A shear control was performed in which a device with collagen gel and HUVECs was placed underflow and an assay was done with no neutrophils nor collagen gel present. Figure 10 illustrates the curved obtained from this experiment.
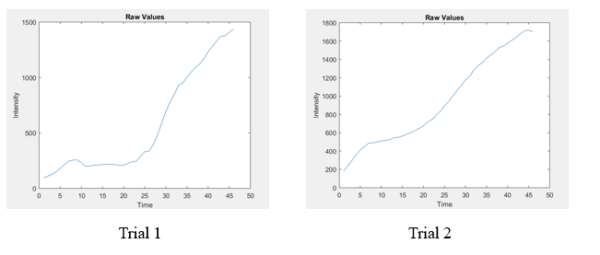
Figure 10: Shear control: device with collagen and HUVECs (left), device with HUVECs but no collagen (right)
Each control went through the assay similarly to the neutrophil experiment. One important aspect of this assay that was investigated was the diffusion of dextran through each membrane. The difference in diffusion through the cell membrane and the collagen gel membrane were vastly important. Each added layer in the device incorporates some degree of resistance in the flow of particles to the bottom chamber of the device shown in figure 6. The travel time required for a particle through the membrane can be calculated by a one-dimensional diffusion model such as in equation 2. Where delta is the distance traveled and D the diffusion coefficient of dextran.
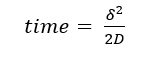 (2)
(2)

Figure 11: Permeability through the device
The images gathered from each experiment were on .tiff files. To determine a length for pixel distance in the experiment a hemocytometer was imaged, and a known length determined. From this analysis, it was determined that 0.25mm is equivalent to 762 pixels. With this information, the appropriate distance from the trench area can be reported.
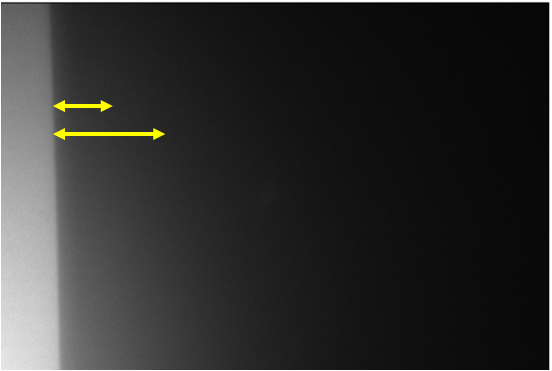
Figure 12: Trench area under flourescence microscope. Yellow arrow show distance away from trench edge.