ADSC Differentiation Due to Porous Membranes Day 1 Results
Overview:
After trying an initial experiment of growing ADSCs on TCP and 3um translucent (TE) membranes and then placing them onto TCP or 3lp SiO2 membranes, it was determined that further studies should be conducted. For this experiment we grew ADSC on TCP, 3um translucent (TE) membranes, and 0.4um transparent (TE) membranes. Once the cells had grown for 7 days, they were trypsinized and placed onto two plates, the first plate was fixed and stained at 24 hours, the second plate was fixed and stained at 7 days. Each of the wells were stained with DAPI, Phalloidin, and NG-2. NG-2 was used to show if they cells were expressing a common progenitor cell marker.
Methods:
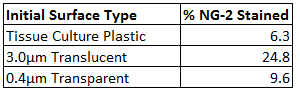
ADSCs were seeded onto each of the track etch membranes and the TCP at 5000 cells/cm^2. There were four samples for each surface type, two of those samples later went to the Day 1 culture and two of those samples went to the Day 7 sample. Once cells were initially seeded, they were left to proliferate for 7 days, the media was changed after 3 days. On day 7 each of the 12 wells in the initial plate was trypsinized and individually counted. Each of the wells was then passaged into the appropriate TCP well on either the Day 1 culture plate or the Day 7 culture plate. All of the wells were TCP for the second seeding of the cells. Using the new Day 1 culture plate, at 24 hours, each of the 6 wells were fixed, permeablized, and stained with DAPI/Phalloidin/NG-2. Thresholds were applied to each of the stain images, and although the DAPI and Phalloidin thresholds vary slightly between each image, the NG-2 thresholds are the same for each of the images. Using 8 10x images for each condition, the number of cells in the images was counted and then the number of cells expressing NG-2 were counted. The percentage of NG-2 expressing cells was then calculated for each condition
Results:
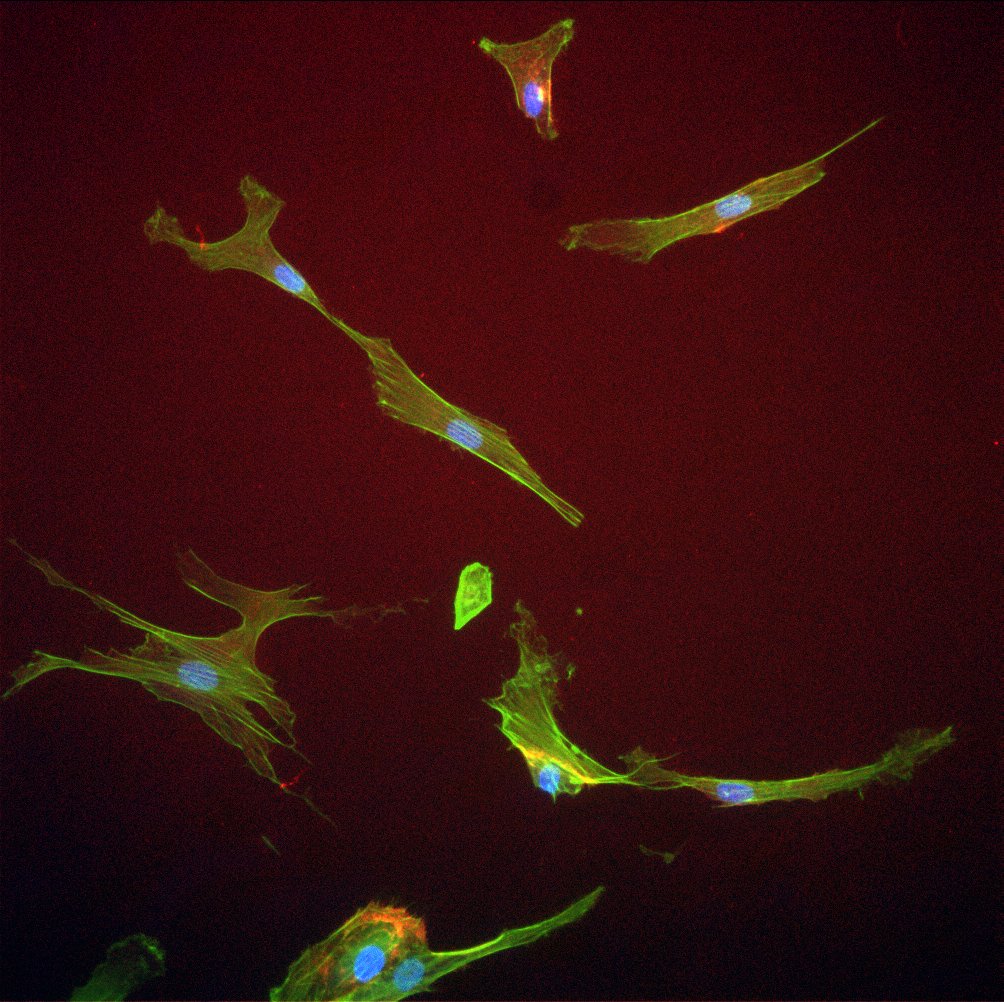
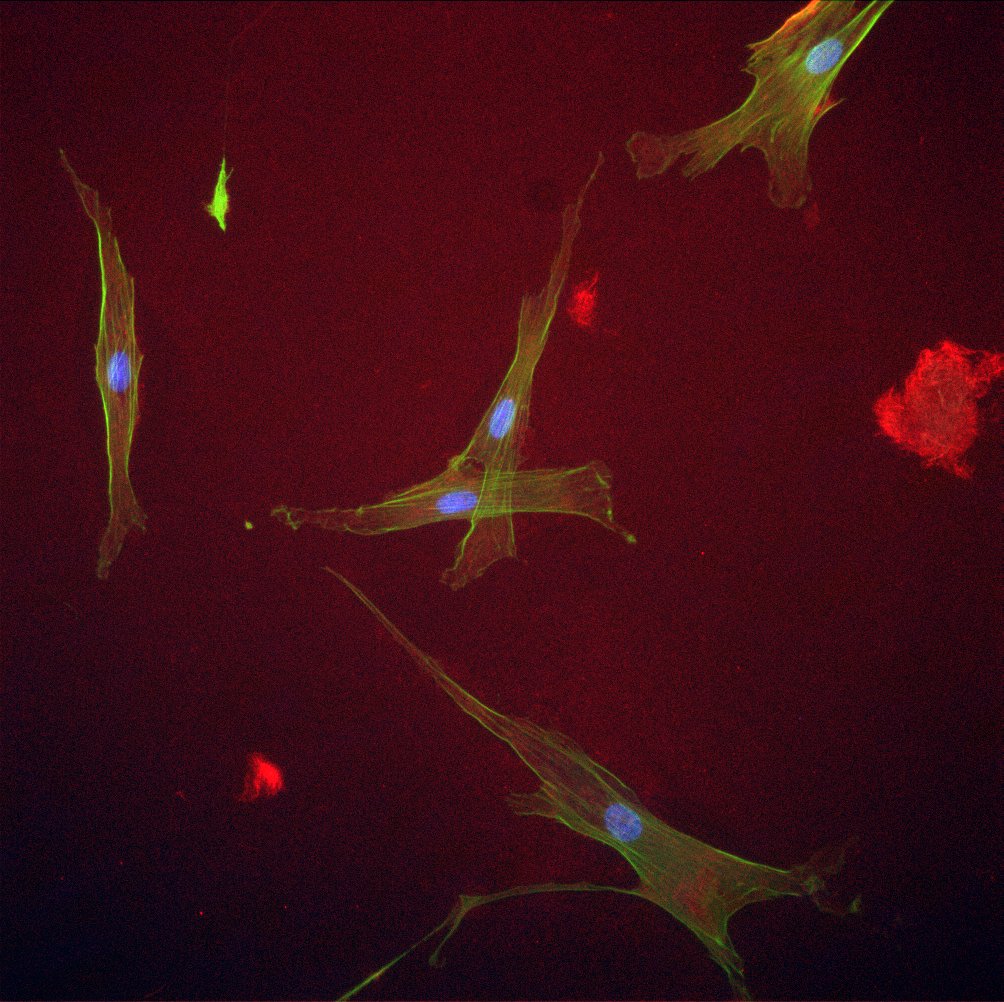
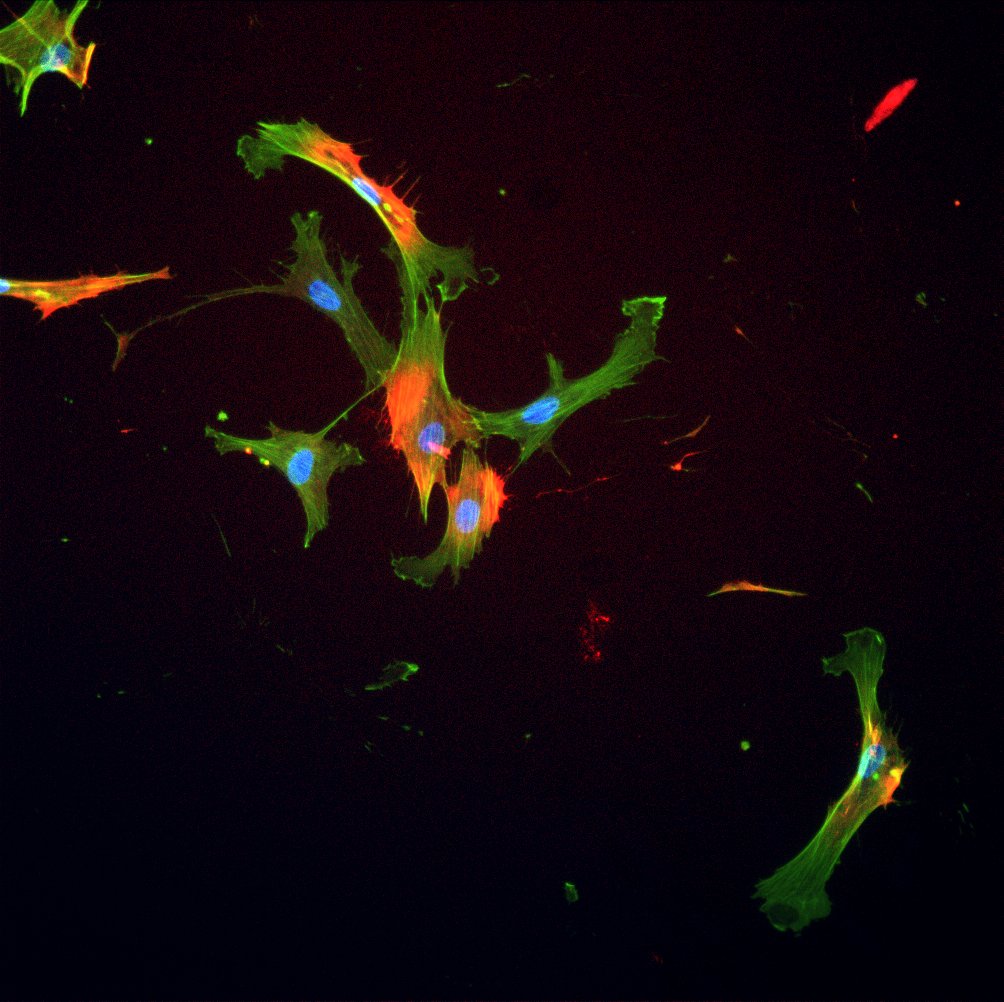
After 1 day, 20x
TCP

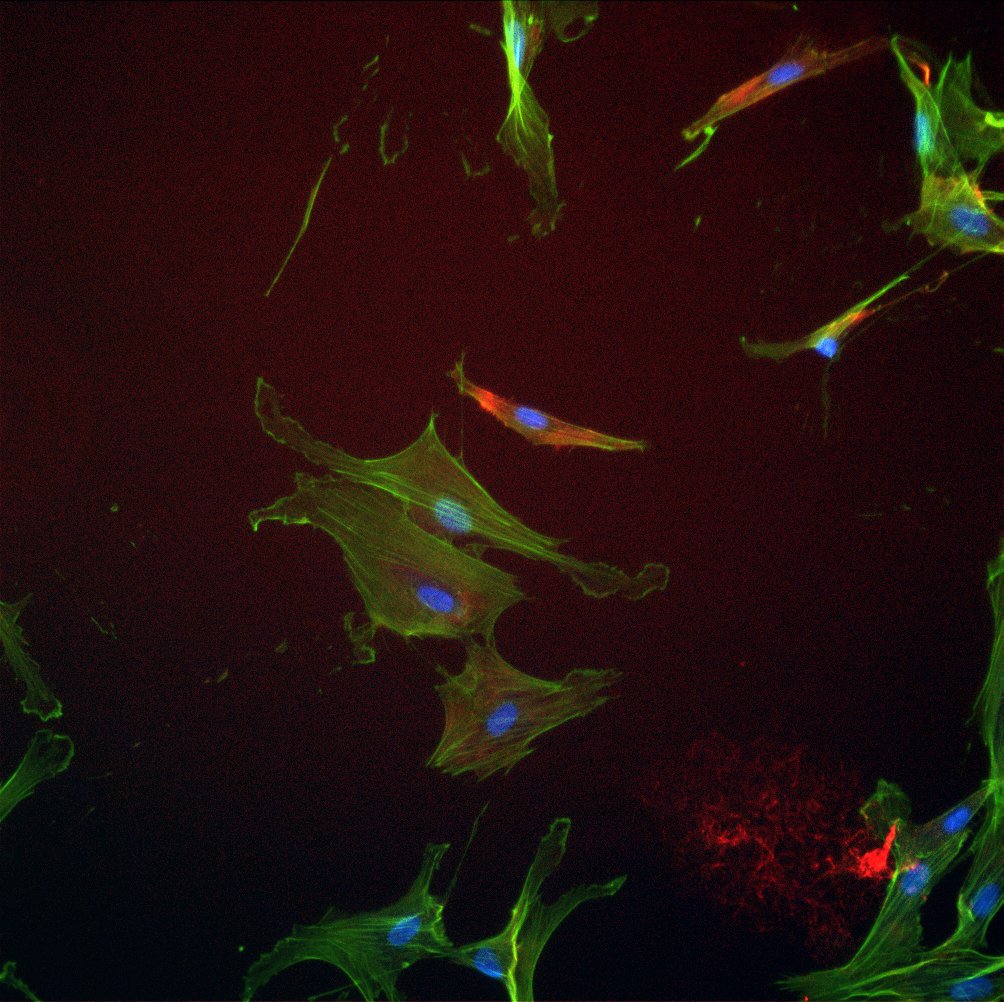
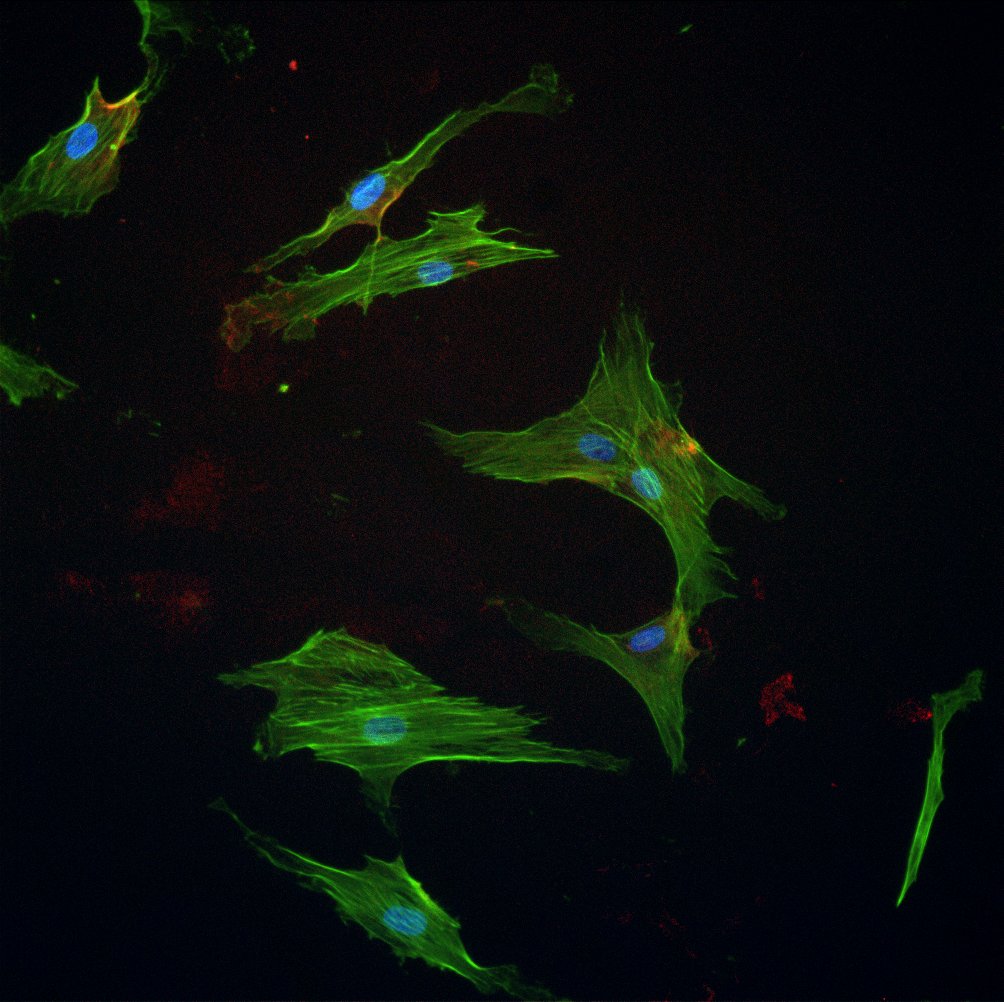
3.0um Translucent


0.4um Transparent


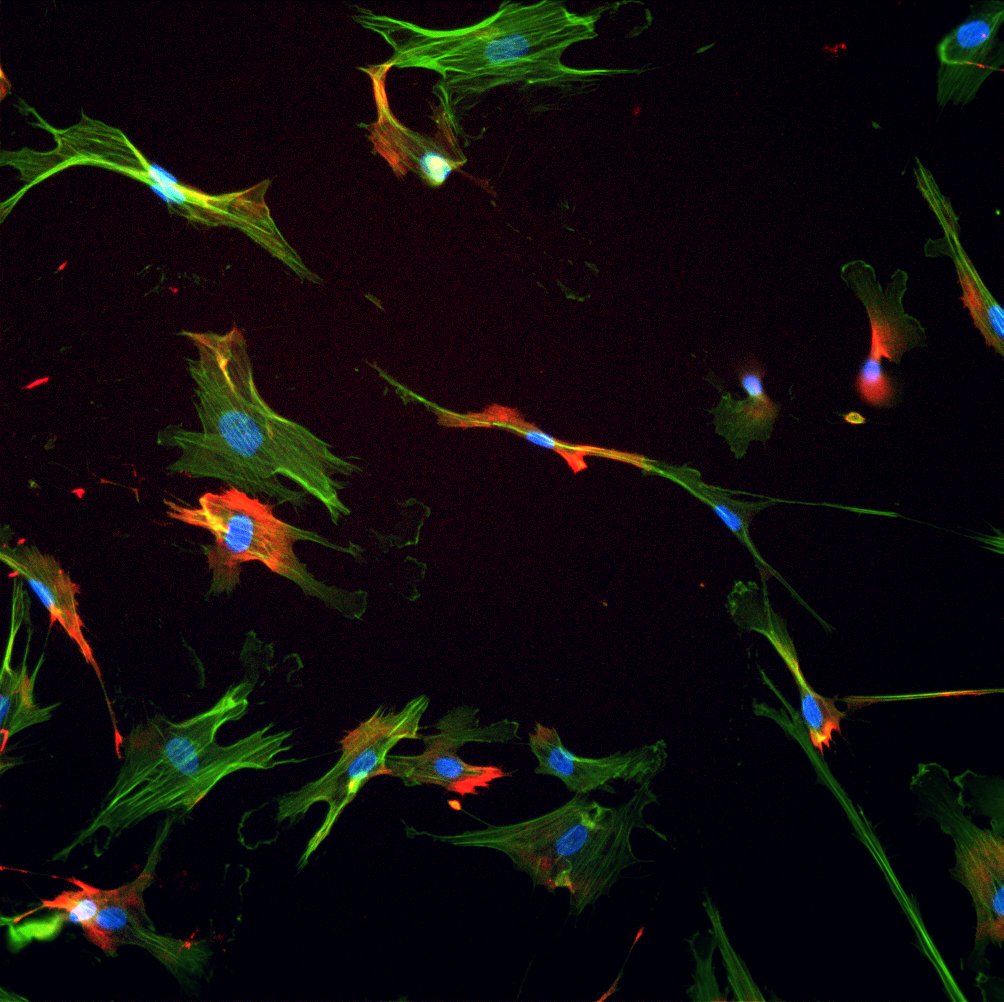
Conclusion:
After adding a threshold to each of the images, it appears that there is more NG-2 present on the cells grown on track etch membranes. The images also appear to show that the 3um translucent membrane wells have expressed the most NG-2. Analysis has also shown that there is a higher percentage of NG-2 expressing cells from the 3um translucent membranes than from the other two surfaces. This is interesting because the 3um translucent membrane is the most porous membrane in the study.