Hemocompatibility Studies
Overview –
The purpose of this study was to perform in vitro hemocompatibility testing (in accordance with ISO standards) on material substrates that could come in contact with blood when incorporated into the final device design of a portable hemodialysis machine. Therefore, understanding the blood response to the lift-off membrane (NPN with SU-8 grid, supported on a silicon wafer) was of particular interest. The six surfaces that were tested included: glass, teflon, PDMS, DEAE cellulose (on a teflon substrate), lift-off membrane, and glass with soluble ADP; ADP is a well-known platelet activator and was added to create a positive control of platelet activation. These surfaces were incubated with platelet-rich plasma (PRP), in a well format, and tested for the generation of thrombin anti-thrombin (TAT) complexes. Results demonstrated that the DEAE cellulose generated the greatest [TAT], while the membrane generated the least [TAT].
Material/Methods –
Design of Wells
The wells were designed to maximize the [TAT] generated by platelets; Based on a previous work by Muthusubramaniam et al, we calculated a reference value for the predicted [TAT], then chose a well design that would allow us to double the reference [TAT] in order to increase our likelihood of detecting a TAT signal in the ELISA assay. The calculations are outlined below:
Muthusubramaniam et al.: 400 μL blood on 10mm x 10mm substrate (area = 100 x 106 m2); study conducted in 24-well tissue culture polystyrene (TCPS) micro- plates (each well = 1.9 cm2).
McGrath Lab (us!): 150 μL PRP on 10mm circle (area = 78 x 106 m2); study conducted in PDMS/silicone gasket wells. 10mm holes were punched into a PDMS slab and then placed on top of 300 μm-thick silicone gasket with 10mm holes cut-in using the Silhouette Cameo. The PDMS/silicone stack was placed on top of each substrate to define a circular substrate area (diameter = 10mm circle; area = 78 x 106 m2). After the TAT ELISA study we plan to label the substrate for platelet and activated platelet marker. If necessary, the top PDMS slab will be removed to allow a closer distance to the microscope objective.
With a platelet concentration of ~3 x 10⁸ /mL we have way more “platelet area” than substrate area. This is true for both our setup and the setup of Muthusubramaniam et al.
total platelet area = [cell density (#/mL) x volume (mL)] x [single platelet area]
single platelet area = π(1μm)2
Assuming that the [TAT] generated is proportional to the number of activated platelets, and that the number of activated cells is proportional to the substrate area, we have:

Where A is the substrate surface area and V is the sample volume.
For us A/V = 0.52, whereas for Muthusubramaniam et al. A/V = 0.25. However, please note that the 400 μL volume is whole blood, whereas for us the 150 μL is PRP. Technically we should have a higher platelet concentration. It is unclear if RBC contributes to TAT generation.
Well Assembly
Each well consisted of the material substrate with the PDMS/silicone stack on top. The rationale behind using a well format is that it allowed us to calculate the precise surface area that the PRP would be in contact with. The gasket layer was designed so that there were three wells for each material surface (n=3).
glass: VWR Cat No. 16004-368
Teflon: FEP Optically Clear Tape made with Teflon® fluoropolymer (will double check if we used the exact same one). NOTE: Since the Teflon film is flimsy, it is reinforced with a glass slide underneath. The Teflon film actually has a silicone adhesive on the other side, which allowed an easy placement on top of the glass.
PDMS: Sylgard 184, cured overnight at 1:10 curing agent to base ratio. NOTE: the same PDMS slab was punched out to defined the well-format. We also tested the PDMS for TAT generation to account for the possibility that the PDMS contribute to some background activation.
Lift-off Membrane: The lift-off membrane (on top of the supporting silicon wafer) was manually cleaved into 26 x26 mm squares using a tungsten glass cutter (essentially, repeated score and snap).
ADP: Purchased from BIO/DATA Corp. 200 μM of ADP was reconstituted using DiH2O. 1:5 dilution in PRP for a final concentration of 40 μM for the positive control.
NOTE: all substrates were cleaned with 70% EtOH and dehydrated.

Isolation of Blood Plasma
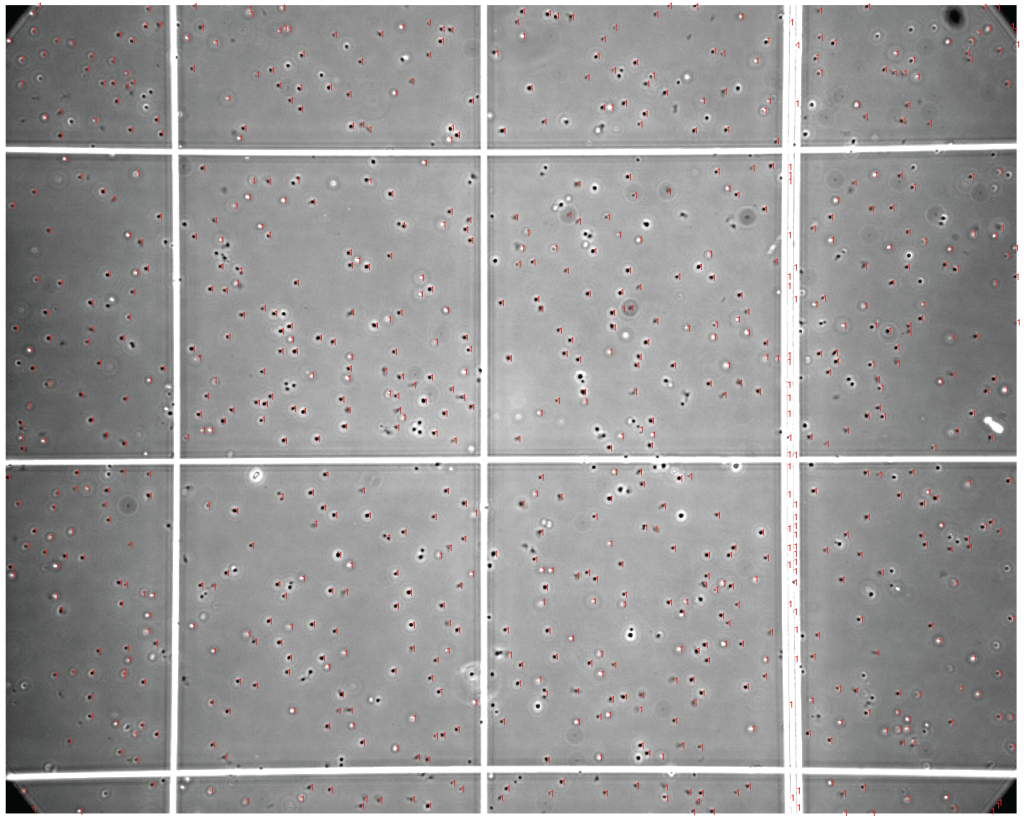
PRP were prepared from whole blood using the standard protocol outlined by Abcam (http://www.abcam.com/protocols/isolation-of-human-platelets-from-whole-blood). To describe briefly, 9 mL whole blood was centrifuged at 200g for 20 minutes in a 15 mL Falcon tube to isolate the platelet-rich plasma (Figure 2). The total number of platelets as well as platelet density was calculated using a MATLAB script. The total platelet count = 975 platelets and total platelet density = 3.66 x 10⁸cells/mL.
ELISA
Abcam TAT human ELISA kit was used in this study. The 150 μL of PRP was incubated inside each well for 2 hr inside the incubator (37C; 5% CO2; 80% humidity). Following, 50 μL of the sample was recovered from each well, and the protocol was carried out according to manufacturer guidelines. Once the samples were tagged with the primary and secondary antibody and incubated with chromagen, results were obtained by using a microplate reader to provide the absorbance values at 450 nm (with a 570 nm background correction).
Results and Discussion –
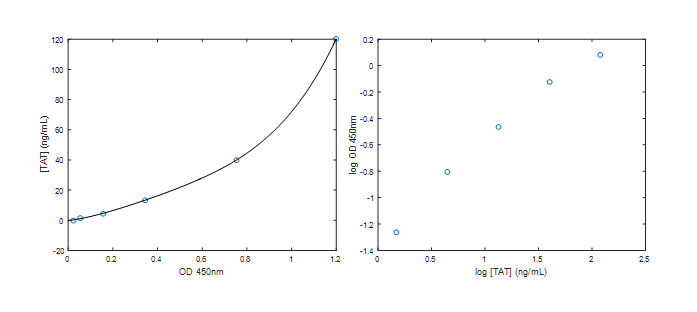
Activated thrombin is inhibited by anti-thrombin III, to form a TAT complex. Therefore, generation of [TAT] complex was used as a measure of coagulation. The standard curve generated from the TAT assay included the following: [TAT] = 1.48, 4.44, 13.33, 40.00, 120 ng/mL (Figure 3)
The results demonstrate that [TAT] generation is greatest for the DEAE cellulose, and lowest for the lift-off membrane (Figure 4). Therefore, these results suggest the lift-off membrane is less thrombogenic than cellulose. This high level of [TAT] generation on the cellulose surface is in line with the work performed by Muthusubramaniam et al. Although the ADP was initially included in this study as a positive control, its surface [TAT] was lower than expected. This response is most likely attributed to the fact that ADP is actually involved in primary hemostatasis, and therefore is limited in its direct activation of thrombin. In the future, a more robust positive control, like ozone-plasma treated glass or factor X (which works together with factor V to directly cleave prothrombin, giving yield to thrombin) should be considered. It should also be noted that although all data points lie above the detection limit of 0.5 ng/mL [TAT] for the assay, many of the data points straddle the 1.48 ng/mL [TAT] on the standard curve.
![Figure 4 – [TAT] generation was used as measure of coagulation on six different material substrates](https://trace-bmps.org/wp-content/uploads/2016/02/Figure-4.png)
Conclusion –
This study demonstrates the the potential of hemocompatibility of the lift-off membrane.
Reference –
How was your standard curve generated? They provided actual [TAT] molecules? Was this done in solution? I ask because there may be an issue with interpreting a surface based assay using a solution based standard.