1236 npMgF2 Temp Series structural comparisons to 1085 npMgF2
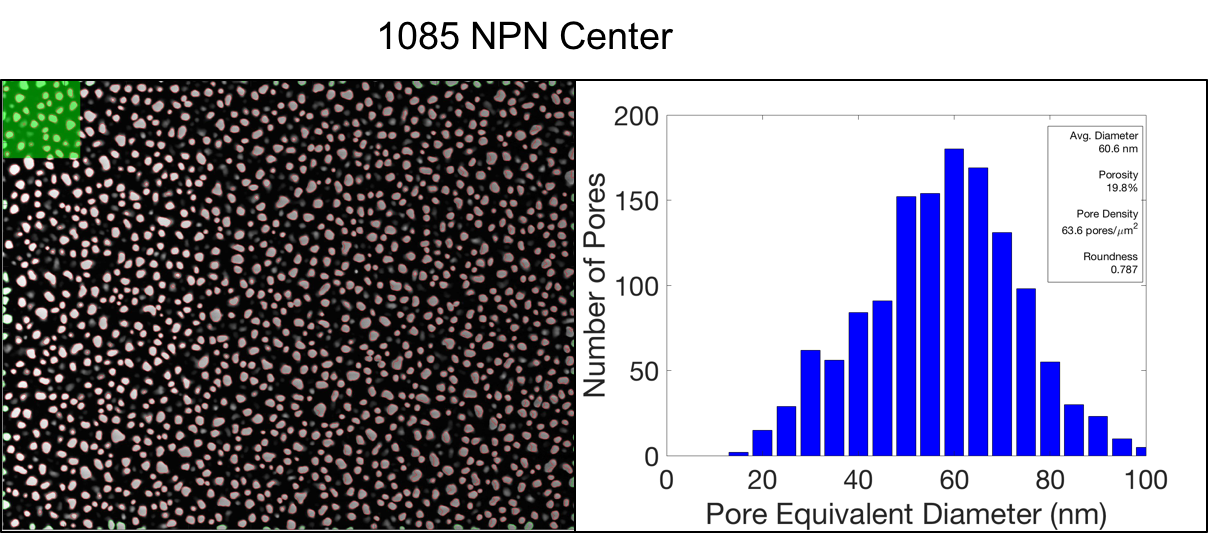
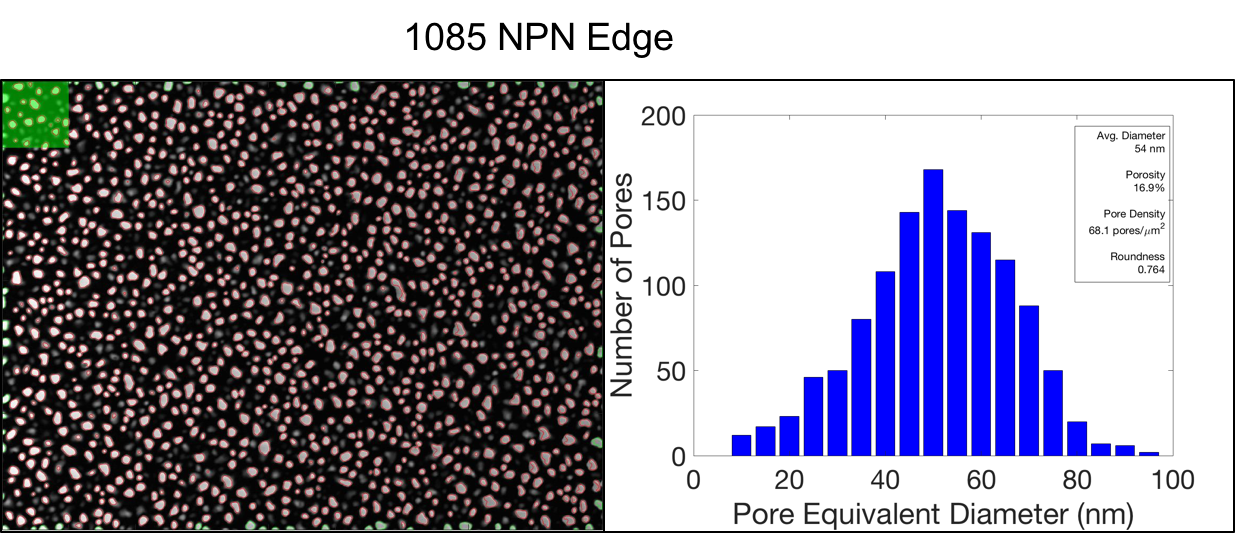
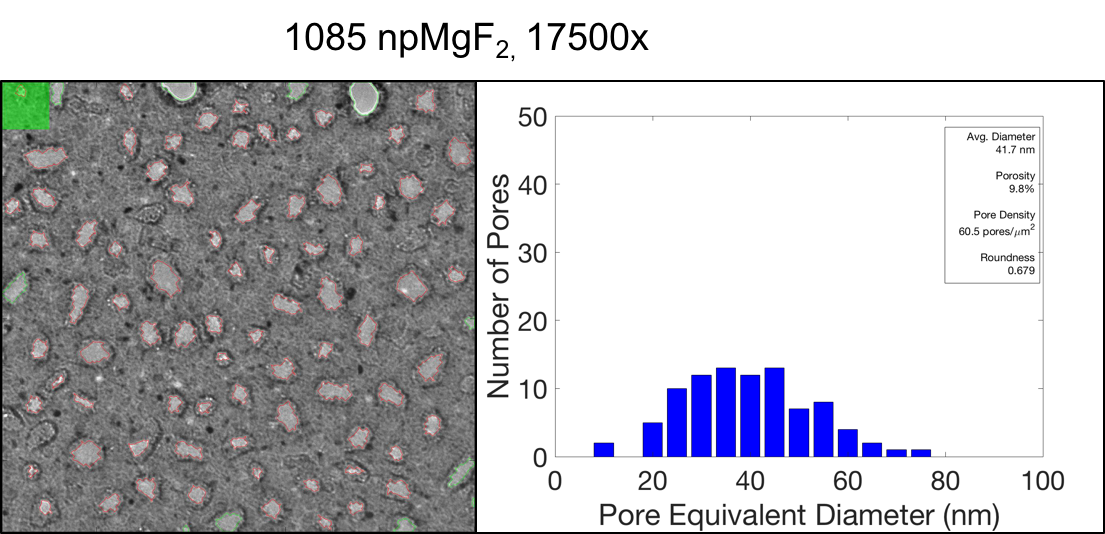
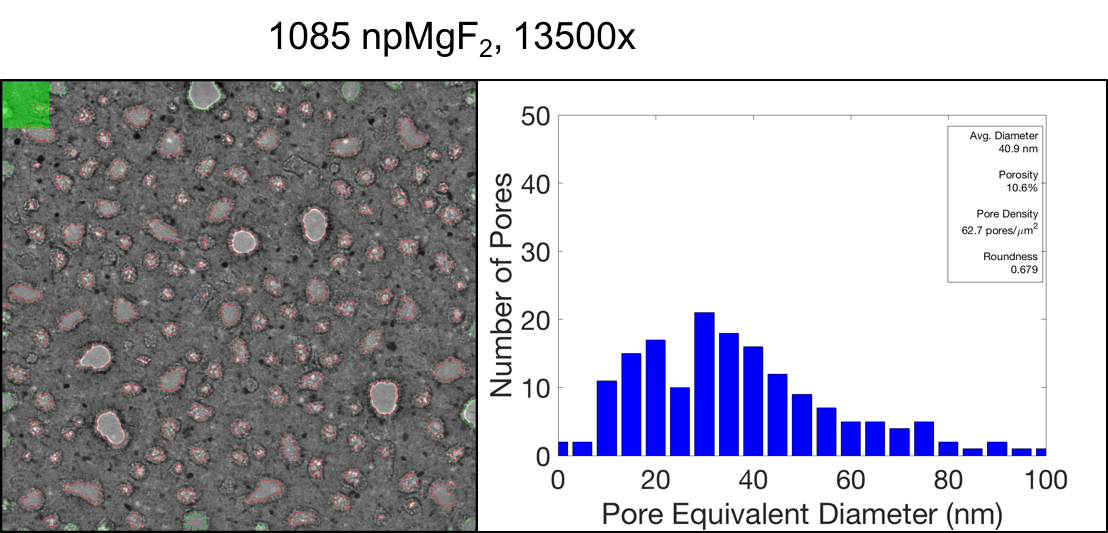
As we run our CCD (Central Composite Design for Optimizing SERS Substrates, SERS Measurements on 150C, 250C, 350C 1236 npMgF2), we have also been gathering TEM/SEM structural information about pore distributions and MgF2 grain structure. This post contains images about materials and compares them to information we know about wafer 1085, one of our original MgF2 materials.
Pore Histograms
1085 based Materials
1236 based Materials
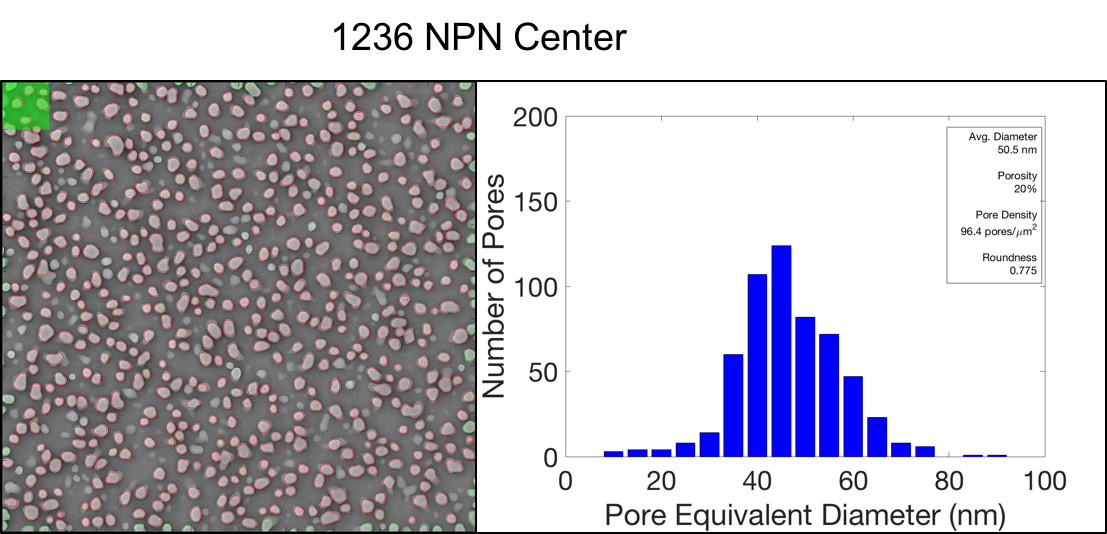
Temp Series
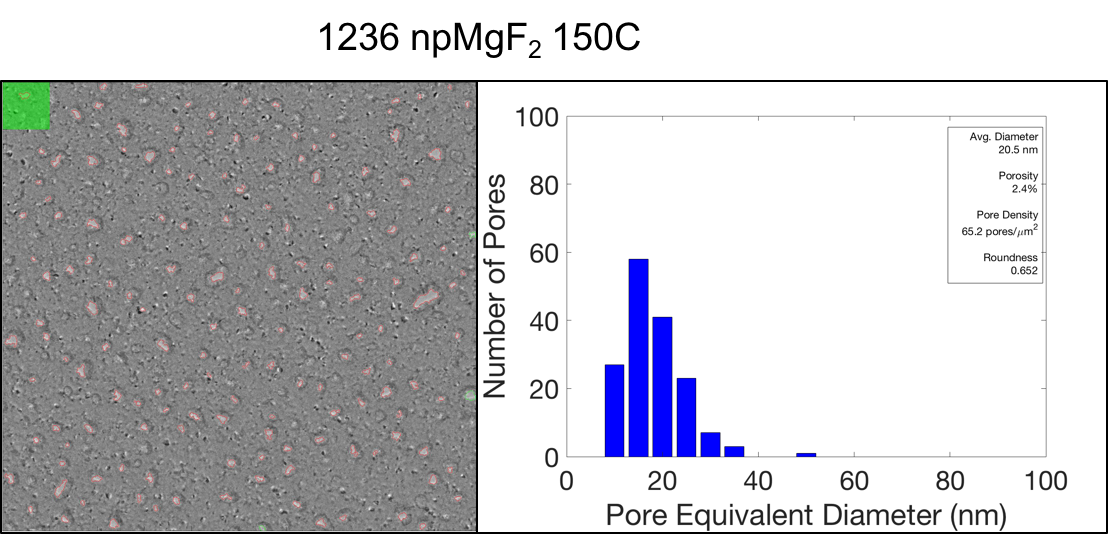
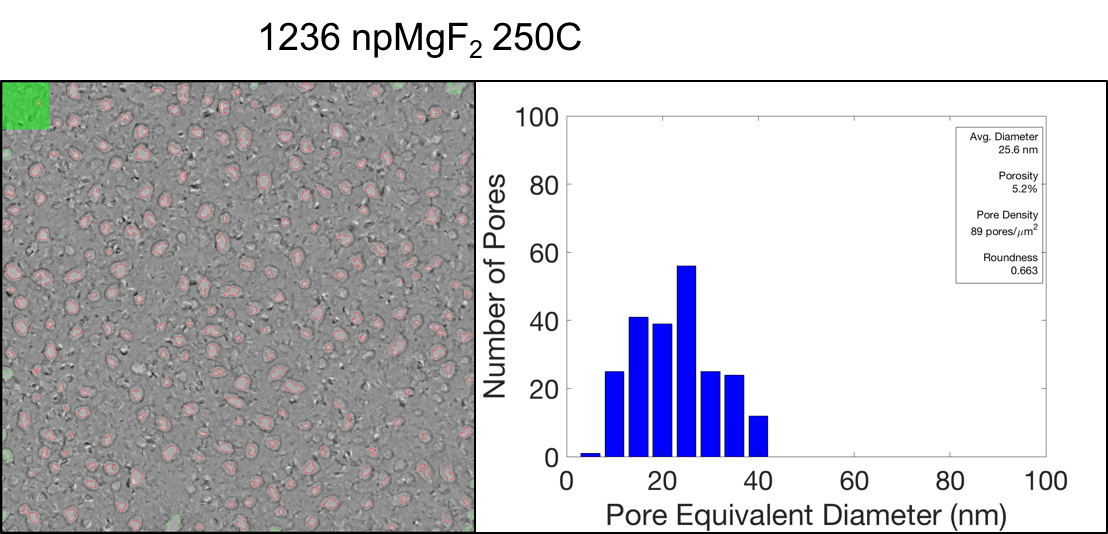
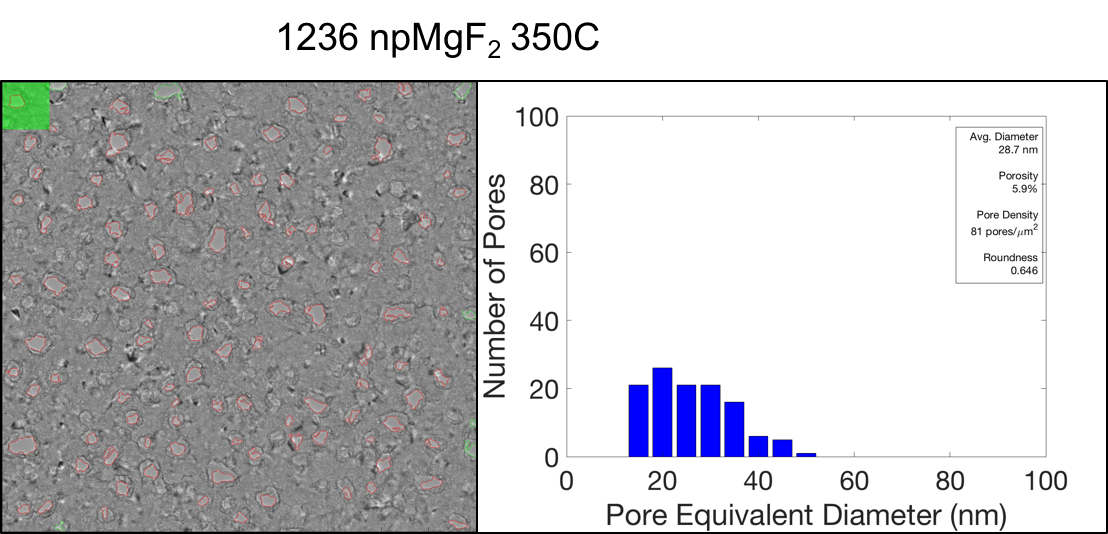
There seems to be a small increase in pore diameter as the MgF2 temperature increases; some of the volcano might be resorbing into the thicker film.
Structural Information
1085 npMgF2
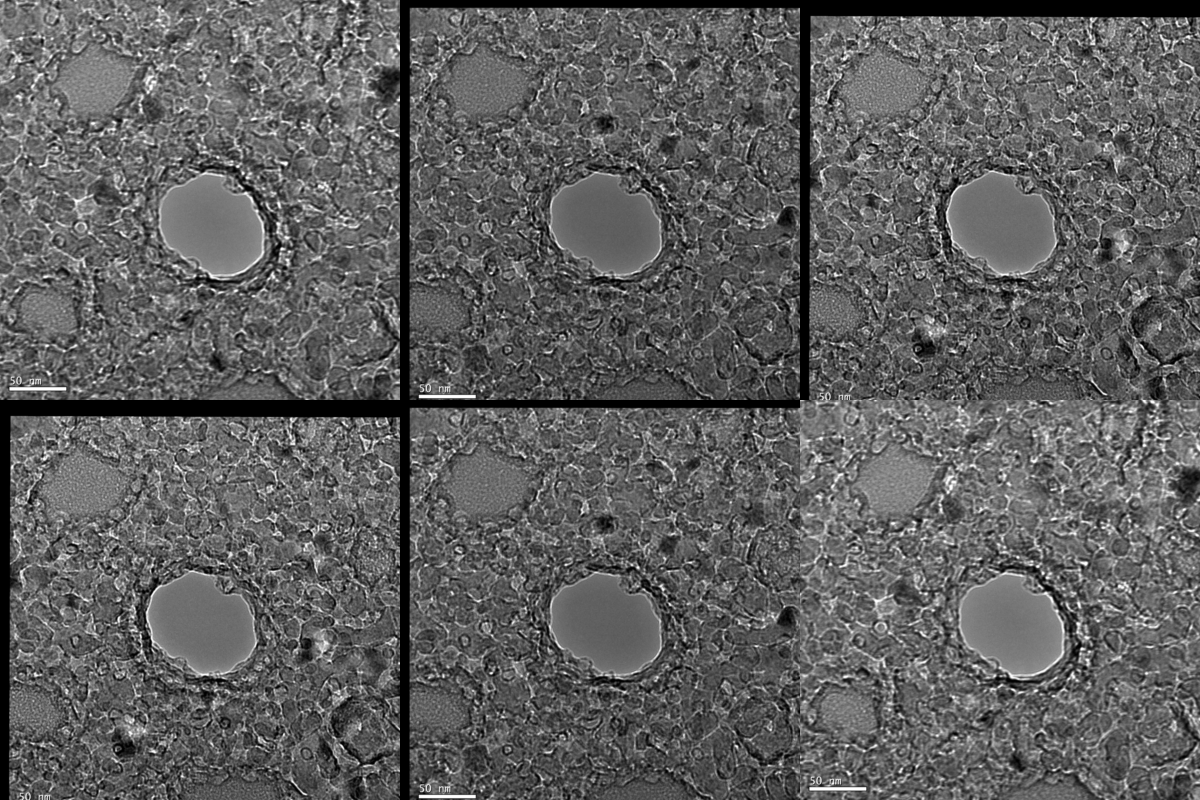
1236 npMgF2
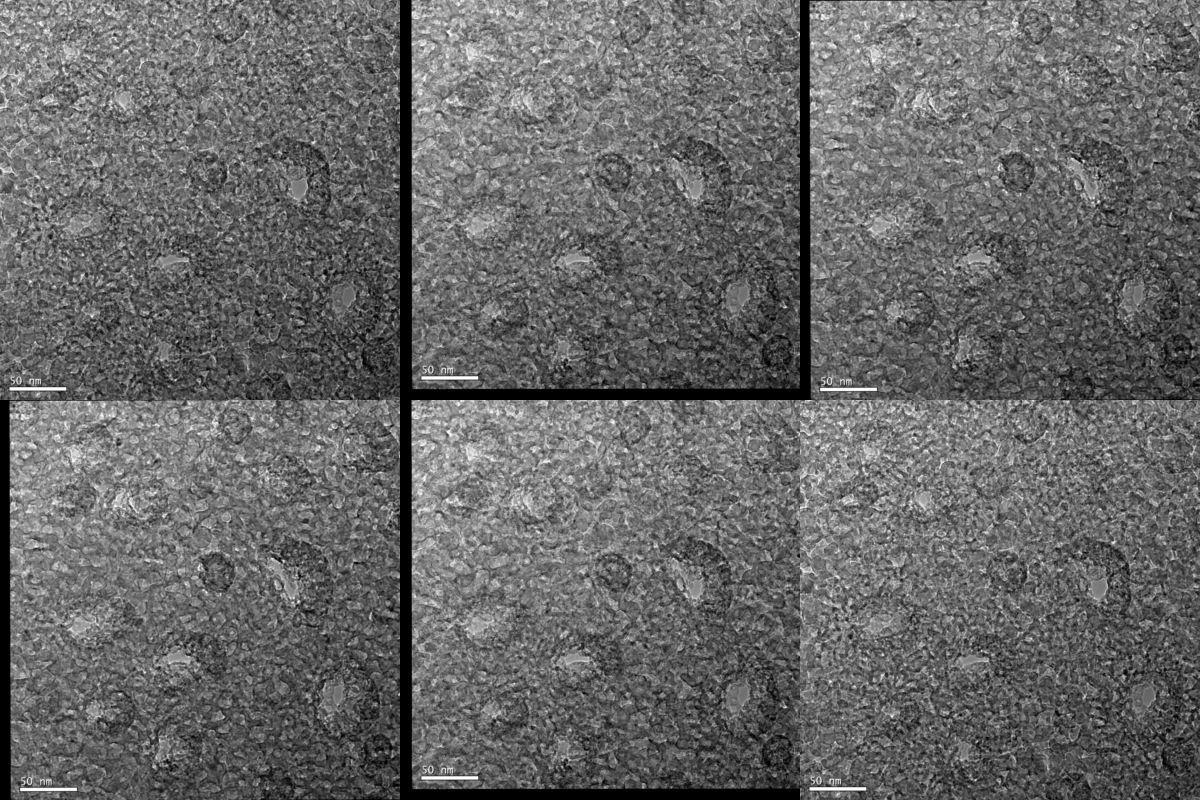
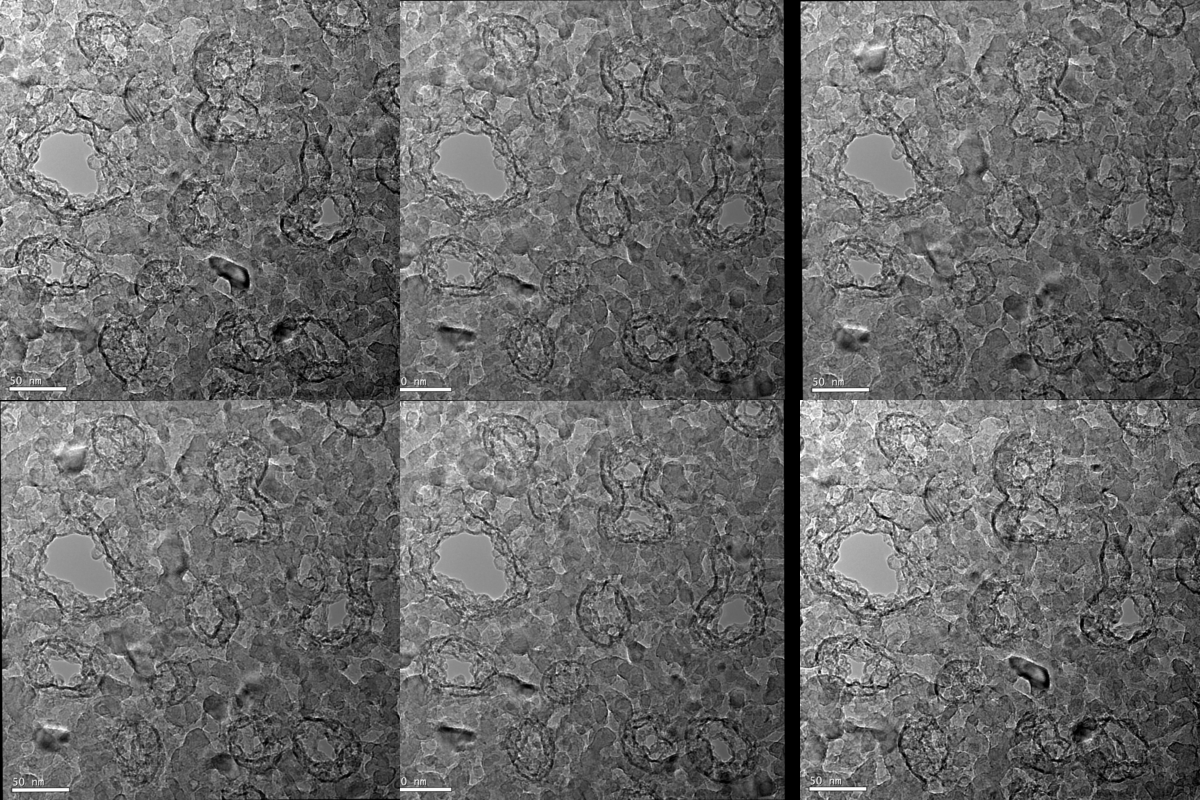
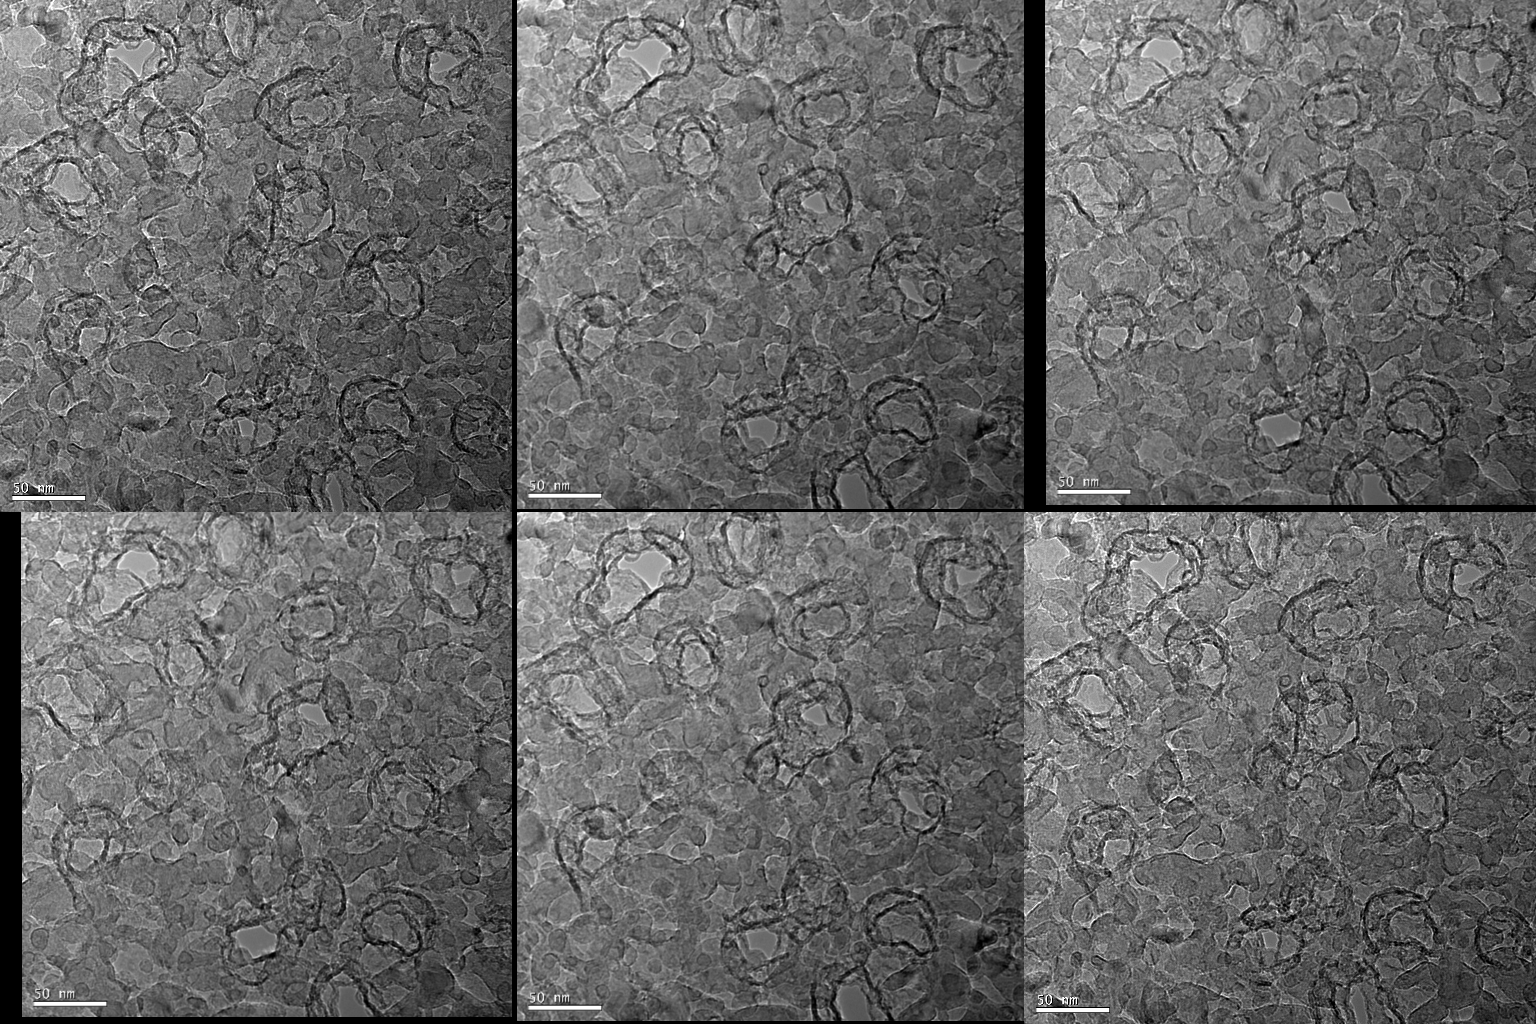
With this series, the npMgF2 structure does seem to change significantly (by eye) between 150C and 250C, and not so much by 350C.