Double Slot: Single-Pass Dialysis Devices Update
This post is meant to conclude the work that I have completed this summer with the double slot single pass devices; recently I have conducted additional experiments and collected ultrafiltration data. In my previous post,
”
https://trace-bmps.org/single-slot-inverted-chip-and-double-slot-single-pass-dialysis-devices/
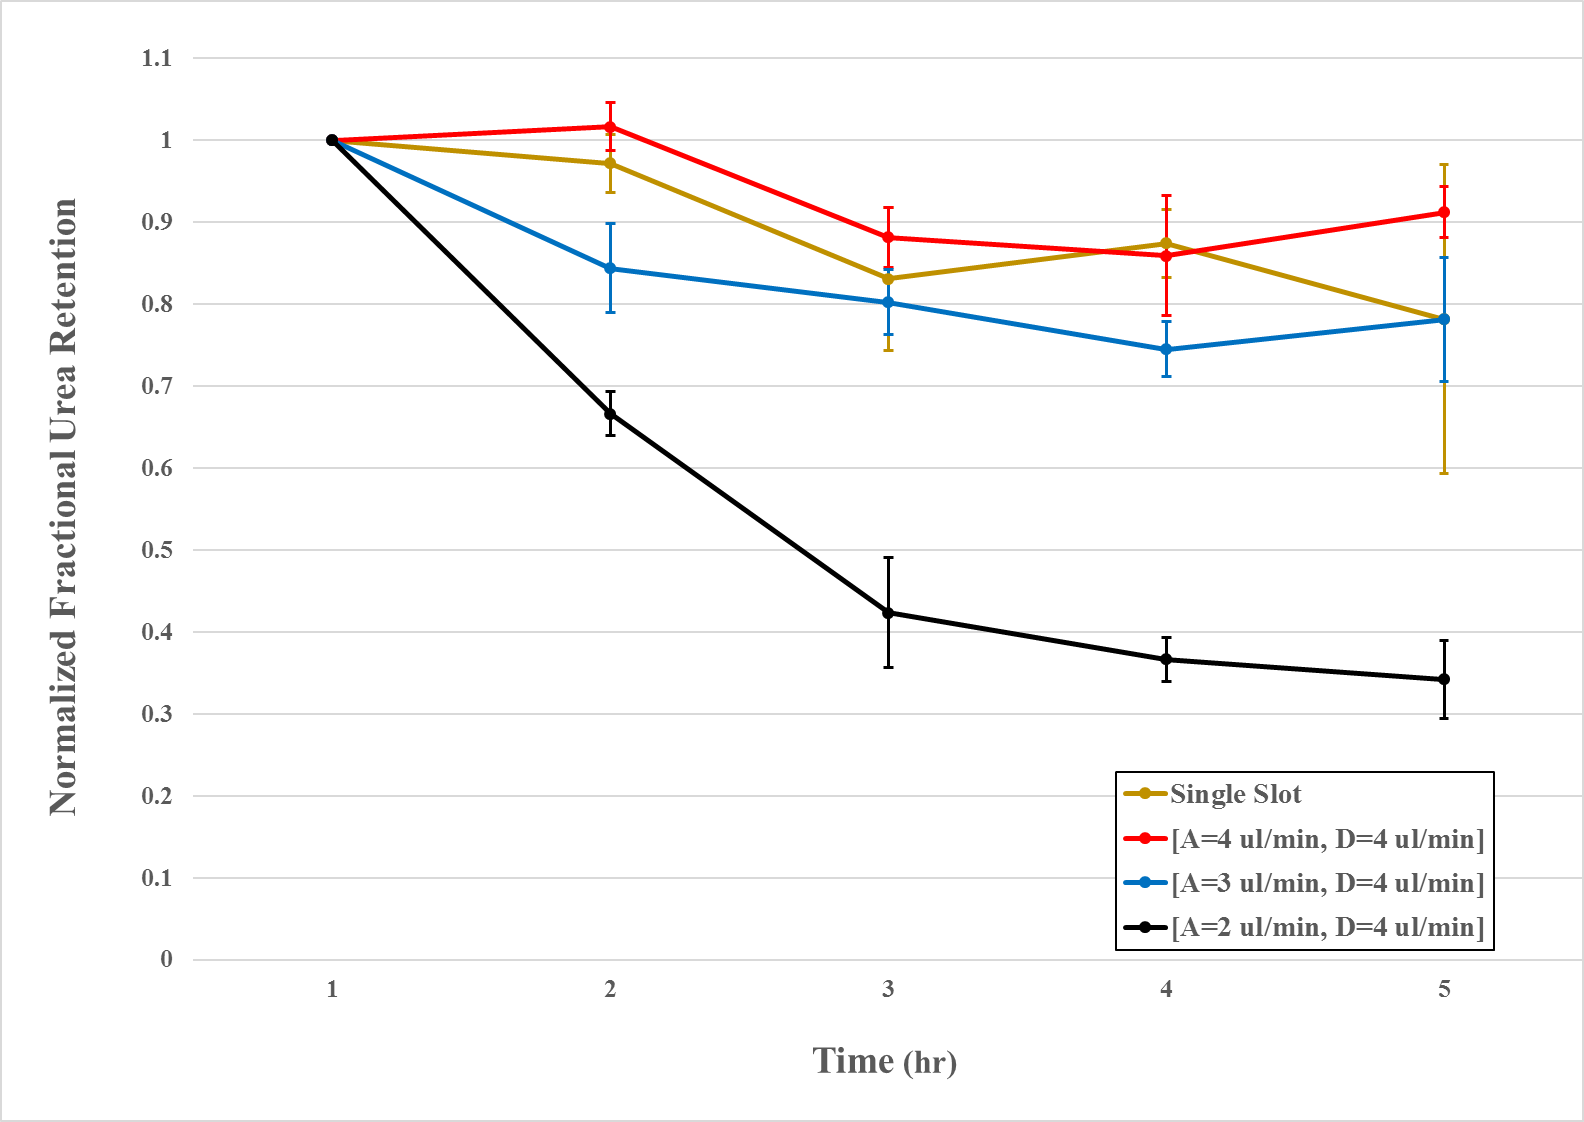
I was exploring how various analyte / dialysate flow rate combinations affected urea clearance. Since then, I have completed a counterflow and concurrent flow experiment triplicate. The following figure presents counterflow results in terms of normalized fractional urea retention (Figure 1).
Another interesting finding is that final clearance values are not linearly related to normalized flow rate combination (the ratio of analyte to dialysate flow rate [Figure 2]).
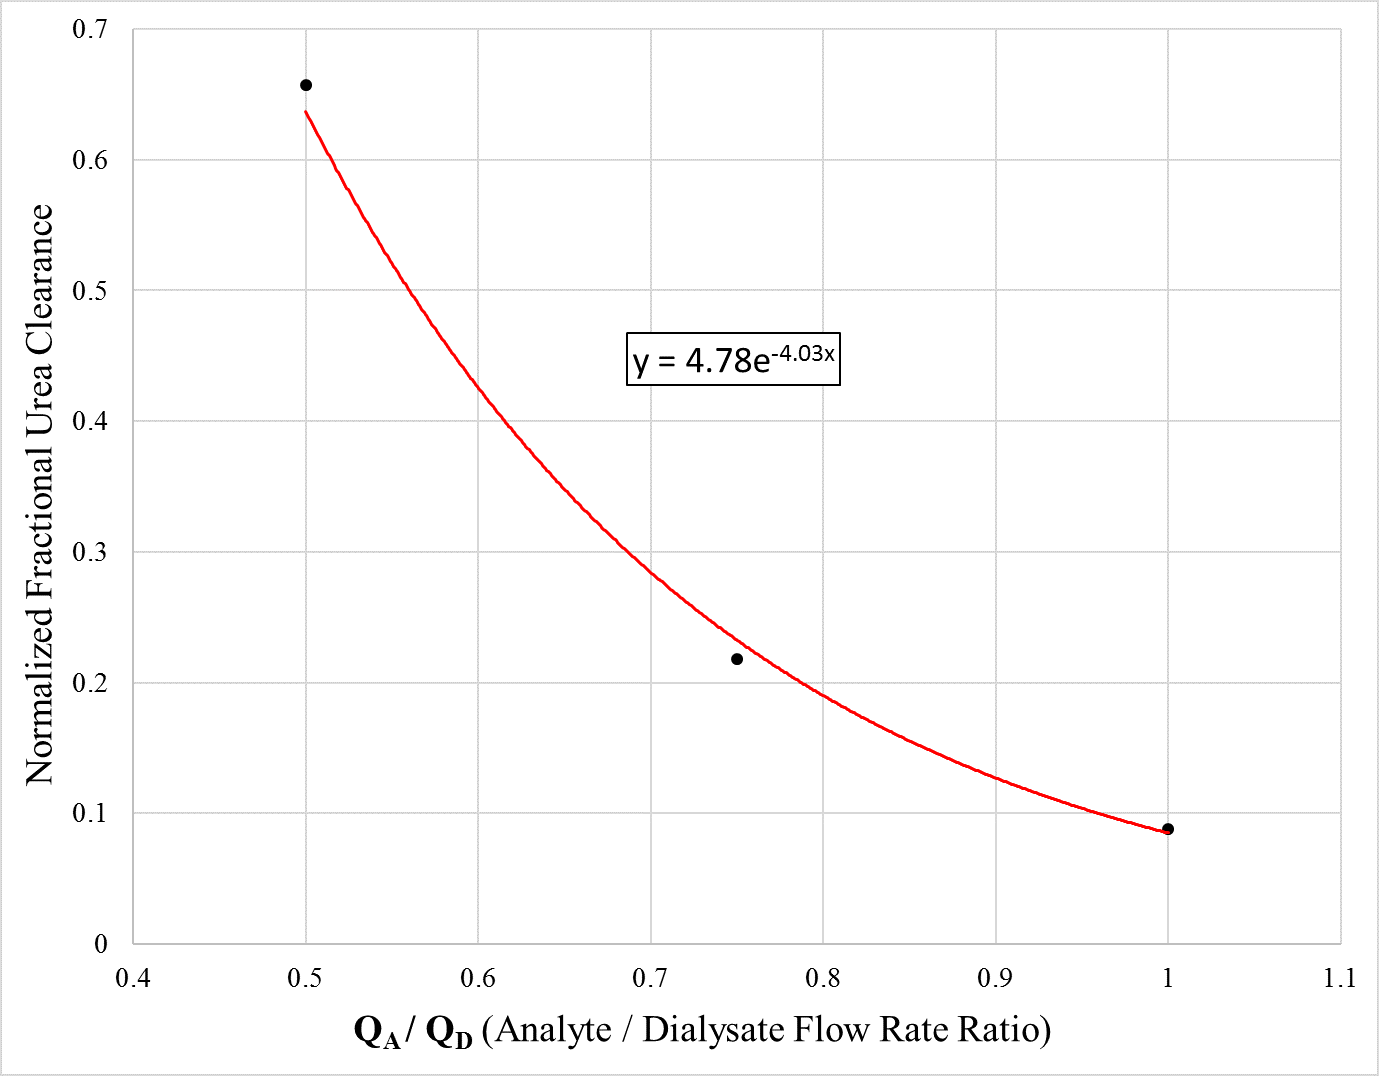
To validate the best fit curve, additional experiments with different flow rate combinations should be conducted to analyze final urea clearance values. Moreover, the asymptotes of this curve should be explored to determine which flow rates offer optimal and minimal clearance as well as which flow rates initiate asymptotic behavior.
All experiments were coupled with some degree of ultrafiltration (Figure 3), which does not allow urea clearance to solely be attributed to diffusion. In an effort to minimize ultrafiltration, concurrent experiments were conducted fixing both analyte and dialysate flow rates at 2 µL/min.
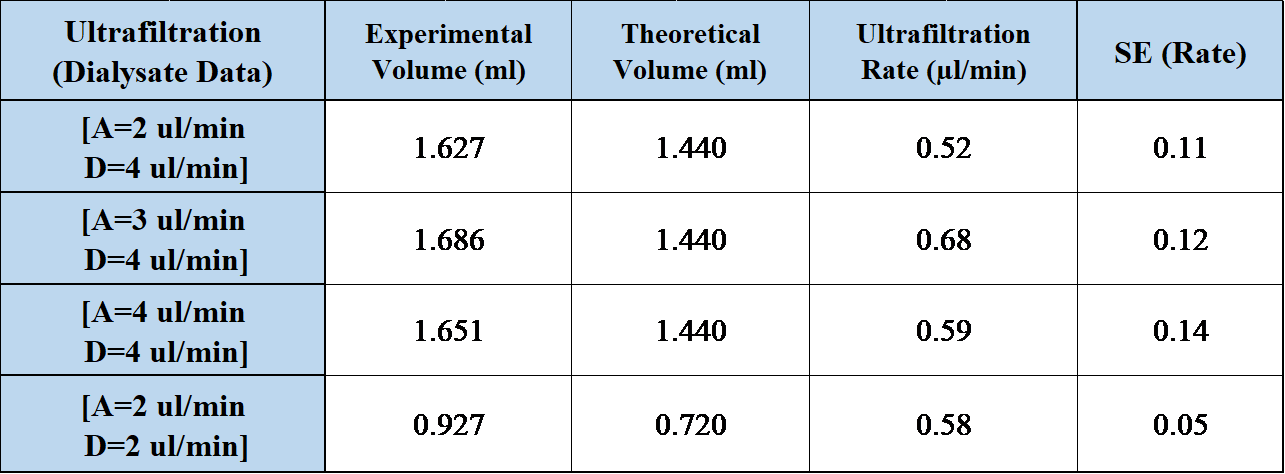
Conversely, the concurrent experiments did not significantly reduce ultrafiltration rates compared to existing counterflow results. To ensure this, ultrafiltration data should be collected from counterflow experiments with both analyte and dialysate flow rates of 2 µL/min, for a definitive comparison. Furthermore, it does not appear that ultrafiltration rate shares a direct relationship with analyte flow rate during counterflow experiments.
Great work Sam. Ultrafiltration is fine and doesn’t hurt any conclusions about clearance through diffusion. Back-flow from dialysate side to sample side however, would be a problem. How did you measure ultrafiltration?
Ultrafiltration was measured by finding the difference between theoretical and experimental dialysate volumes. Theoretical volume was defined as the set input from the syringe pump, and experimental volume was found by weighing the dialysate collection vessels after each experiment.