Comparison of Metrics to Quantify Fibrillar ECM Alignment
The physical properties of the extracellular matrix such as stiffness, viscoelasticity, fiber diameter, and chemical composition are well known as important modulators of cell behavior in vivo. Therefore, over the past decade, there has been a major emphasis on characterizing the properties of the in vivo ECM and also engineered matrices in vitro. In this context, properties such as stiffness, viscoelasticity, and pore fraction are easily characterized using standardized methods that are widely reported in the literature. The standardization of measuring these physical properties enables the direct comparison of data across different studies and helps researchers better contextualize findings within the literature.
An important modulator of cell behavior in collagen-rich tissues such as musculoskeletal tissue, cardiac tissue, the tumor stroma, and the cornea is the alignment of collagen fibers. Collagen fiber alignment has been shown to promote persistence in migrating cells, modulate cell polarization, gene expression, and differentiation. Therefore, fiber alignment plays an important role in tumor metastasis, angiogenesis, wound healing, and regulation of t-cell migration. To better model these processes in vitro, significant effort has been directed at gaining control over a self-assembling collagen hydrogel in vitro to exhibit fiber alignment. Methods for aligning collagen fibers include a) direct application of strain, b) fibroblast mediated compaction, c)magnetic methods, and d)microfluidic methods. To measure the alignment of collagen fibers, imaging-based techniques are commonly used. Collagen fibers are imaged using 3 modalities i) second harmonic generation two-photon microscopy, ii) fluorescence microscopy and iii) reflection microscopy. In each case, the data obtained from the micrographs are very similar. However, the quantification and analysis of the imaged collagen fibers vary widely from study to study, which makes it difficult to compare the fiber alignments. The format of reporting the data in the literature varies from showing angle histograms of fiber alignment to self-contrived metrics. Additionally, cell behaviors that are observed in response to a specific degree of fiber alignment cannot be contextualized across different studies. Therefore, it is important to provide guidance on how to interpret the results of fiber alignment that are presented in the literature such that researchers can make direct comparisons between different works.
In this short study, we aim to provide a guide to researchers in the field of fiber alignment to interpret the various metrics that are reported regarding alignment in the literature. Over the course of the past few years, our lab has amassed a large database of collagen images with varying degrees of fiber alignment. To establish the “ground truth” of fiber alignment, the images were sorted into categories of high, medium, and low alignment by an impartial observer. In this study, we have collected 5 commonly used methods for reporting fiber alignment and compared the outputs of these methods on our database of images. To enable an intuitive understanding of the different methods, we are comparing all the values against a metric we define as “coefficient of alignment”. The coefficient of alignment describes the fraction of fibers in an image that are aligned in the principal axis of fiber alignment. We are not seeking to endorse one method over the other, rather this study provides a reference to compare alignment values that are reported across the literature.
Methods:
Presorting images of collagen fibers based on ground truth
An impartial observer was provided with a database of 300 images of collagen fibers that were recorded by us using confocal reflectance microscopy. The observer was asked to classify the images into high, medium, and low alignment to set a baseline for the “ground truth” of alignment. Within each classified subgroup, 25 images were randomly picked for processing and statistical analyses.
Review of methods used in literature
CT-FIRE/Abhyankar method:
Nerger/Nelson
Used Directionality PlugIn for ImageJ (https://imagej.net/plugins/directionality) to determine the Local Gradient orientation which computes a histogram of fibers aligned in the same direction.
To calculate the alignment fraction, the mode of the output histogram is found with +/- 20 degrees, and then divided by the sum of all fibers:
Alignment fraction = aligned intensity gradients / total intensity gradients
Nerger BA, Brun PT, Nelson CM. Microextrusion printing cell-laden networks of type I collagen with patterned fiber alignment and geometry. Soft Matter. 2019 Jul 17;15(28):5728-5738. doi: 10.1039/c8sm02605j. PMID: 31267114; PMCID: PMC6639139.
OrientationJ
The orientation is evaluated for every pixel of the image based on the structure tensor. A histogram of orientations is built taking into account the pixel that has a coherency larger than min-coherency and energy larger than min-energy. The histogram is a weighted histogram, the weight is the coherency itself. The min-coherency is expressed as % since the coherency factor is an index between 0 and 1. The min-energy is expressed in % of the maximum energy of the image.
CoA is calculated as the fraction of fibers within ±15˚ of the mode of the histogram.
CurveAlign
CurveAlign is a quantitative tool for interpreting the regional interaction between collagen and tumors by assessment of up to ~thirty stromal fiber features, including angle, alignment, and density. CurveAlign can incorporate fiber extraction from CT-FIRE, another open-source tool best suited for individual fiber analysis and can use a machine learning Support Vector Machine (SVM) approach to rank disease-associated features. CurveAlign provides a metric “COA” to quantify fiber alignment in an image. CurveAlign is based on on CT-FIRE.
Provanzano
This method provides an alignment index, where a value of 1 denotes a perfect distribution of fiber angles. This method relies on the output data of CT-FIRE histogram of fiber angle. The following formula is then applied:
Alignment index = [180/sqrt(12)] / (stdev of the fiber angles for a given image)
Ray A, Slama ZM, Morford RK, Madden SA, Provenzano PP. Enhanced Directional Migration of Cancer Stem Cells in 3D Aligned Collagen Matrices. Biophys J. 2017 Mar 14;112(5):1023-1036. doi: 10.1016/j.bpj.2017.01.007. PMID: 28297639; PMCID: PMC5355487.
FFT/Taufelele and Reinhart-King
The FFT method was created by Taufalele in the Reinhart-King lab by making modifications and a costume MatLab code for a method created by Ioannis V.Yannas. FFT uses 2D autocorrection to compute pore size, and adjacent pixels with the same pore size were group together and categorized as on (pores) or off (collagen fibers). From the pixel count, the average pore diameter was calculated and a Fourier transform method was used to fit an ellipse to the power spectrum.
To calculate CoA, the aspect ratio of the resulting ellipse was computed by hand or by a costume MatLab code.
Taufalele PV, VanderBurgh JA, Muñoz A, Zanotelli MR, Reinhart-King CA. Fiber alignment drives changes in architectural and mechanical features in collagen matrices. PLoS One. 2019 May 15;14(5):e0216537. doi: 10.1371/journal.pone.0216537. PMID: 31091287; PMCID: PMC6519824.
Ariel G. Ferdman, Ioannis V. Yannas. Scattering of Light from Histologic Sections: A New Method for the Analysis of Connective Tissue. Journal of Investigative Dermatology. Volume 100, Issue 5,1993. Pages 710-716. ISSN 0022-202X. https://doi.org/10.1111/1523-1747.ep12472364
Statistical analysis
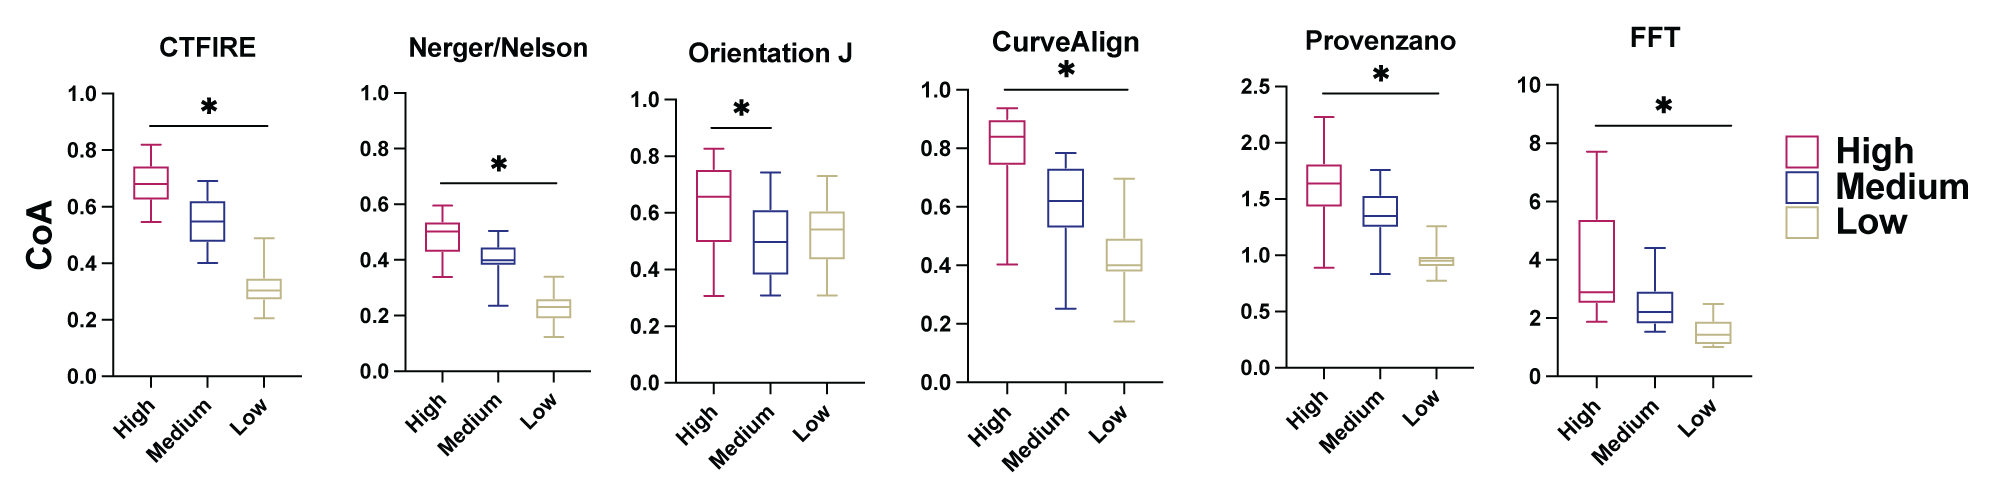
Data is reported as box plots, a centerline at the median. The box denotes 25-75 percentile of the data with whiskers showing 5-95 percentiles. 1-way ANOVA was used to compare data, with significance reported as p<0.05. n=25.
Link to images sorted by ground truth
High Alignment: High Alignment Collagen Fiber Images
Medium Alignment: Medium Alignment Collagen Fibers Images
Low Alignment: Low Alignment Collagen Fiber Images
Results