Modeling Oxygen and Urea transfer in Nanomembrane Devices
Introduction
Extracorporeal membrane oxygenation (ECMO) devices are used to supply oxygen to patients when they are unable to get sufficient oxygen through their lungs. Miniaturizing an ECMO device could be beneficial for neonatal patients, as it would require less blood to prime the device and operate efficiently at a lower overall flow volume. Dialysis is able to replace some function of the kidneys in waste removal. Miniaturizing these would help decrease the cost and aid in mobility of patients requiring dialysis. A novel design of a membrane holding device which could be used for either of these applications is explored via a numerical study.
Methods
Blood flows into an expanded channel, which then shifts toward the membrane, separating into 5 channels in order to accommodate support bars for the membrane. The channels then recombine and exit the other end of the device. Two of these devices are combined with a semi-permeable membrane between them. This setup can be used for the transfer of urea to dialysate liquid to create a small scale dialysis unit. It can also be used with pressurized oxygen to form the novel ECMO device. The baseline model consists of just the simple 5 channel set-up. A higher mixing design includes a set of herring-bone type of vortex generating mixing vanes, added just above the membrane to help mix flow and enhance diffusion.
Urea Modeling
For the urea simulation, the blood urea level was set to 1 to represent 100% of the baseline urea concentration, while the dialysate fluid inlet was set to 0. Comparable flow of dialysate was sent through the inlet of the dialysate side. The change in concentration at the dialysate and blood exits could provide 2 measurement opportunities for the performance of the membrane.
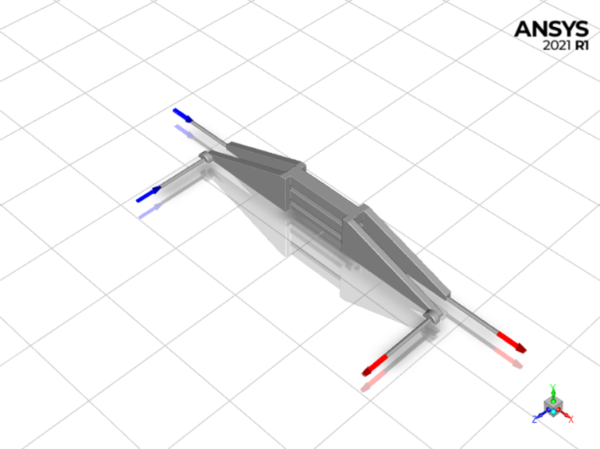
Fig. 1: Baseline Geometry
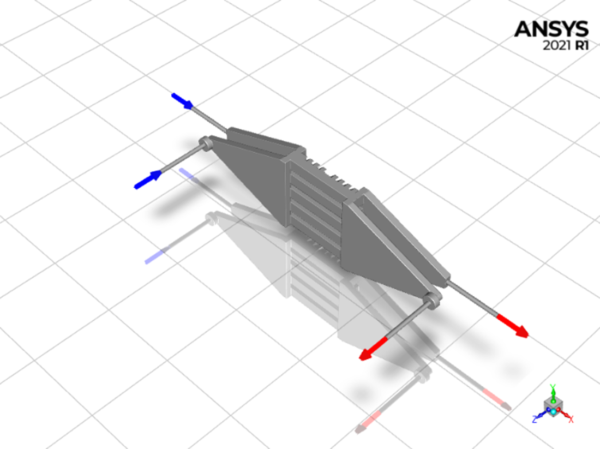
Fig. 2: Herringbone Geometry
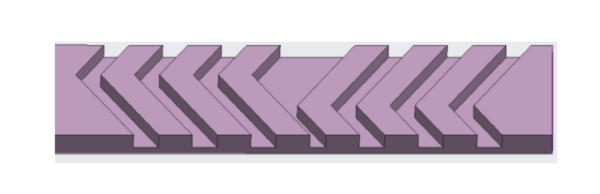
Fig. 3: Herringbone Mixer Detail (Opposite side from the membrane)
Oxygen modeling
ECMO geometries were modeled in ANSYS Fluent. A UDF developed by Matthew Poskus to model the diffusion of urea across a membrane for a dialysis device was used to initially compare models for dialysis. This UDF code was then modified to model Oxygenation, replacing concentration on the dialysate side with a constant pressure of Oxygen gas. The uptake of oxygen was divided into a more complicated term to convert the amount of oxygen transferred, dependent on the partial pressure of oxygen (PO2) and the gas pressure, to the amount of oxygen that can be absorbed by the hemoglobin in the blood. This allows a more accurate transfer modeling for the saturation level of the blood (SO2). A more accurate diffusion term for within the blood is still in development. It will likely allow for higher diffusion of oxygen, based on preliminary research on the comparative levels of diffusion for oxygen within blood to that of urea.
For the oxygen diffusion simulations, the blood inlet was set to 60% saturation, in order to match an experimental model that was in development. The oxygen side was varied in pressure from 2 psi to 16.7 psi. The SO2 at the blood outlet would be flow averaged to gauge the performance of each set-up.
Results
The herringbone mixer model is seen to have higher amounts of vorticity generated in the flow. This results in a greater percent of the flow coming close to the membrane side of the device. Greater mixing aids in the diffusion and transport processes.
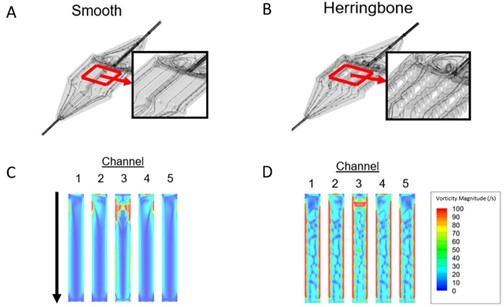
Fig. 4: (A) Device with smooth channels (i.e. baseline), (B) Device with herringbone features within the channels (herringbone), (C) Visualization of vorticity magnitude in the baseline device, (D) Visualization of vorticity magnitude in the herringbone device.
Urea Results
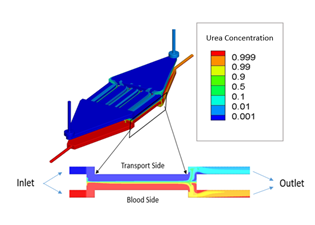
Fig. 5: Urea Transport
Urea Results
The mixing is seen to greatly affect the amount of urea removed by the device in dialysis modeling. At 10 mL/min, the baseline case removed 0.58% of the urea, while the herringbone case removed 1.33%, a ratio of 2.3.
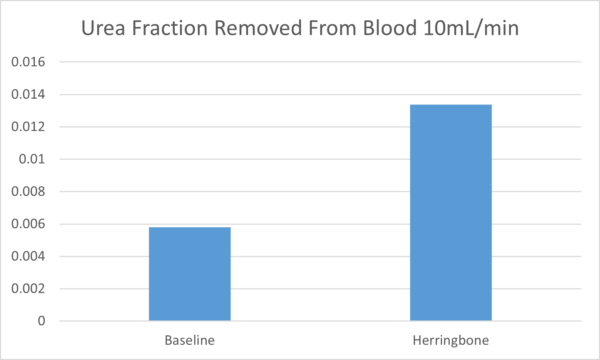
Fig. 6: Dialysis Comparison
Oxygen Results
An initial sweep of the operating conditions showed a predictably higher rate of oxygenation for higher pressure oxygen, and a significant advantage of the herringbone mixer over the baseline model. A significantly lower oxygenation rate was seen for lower blood flow rate. This difference was less pronounced for the herringbone mixer type than for the baseline case. This variation was the inverse of early experimental trends, so a further study was done on the baseline case to see whether this was a universal trend.
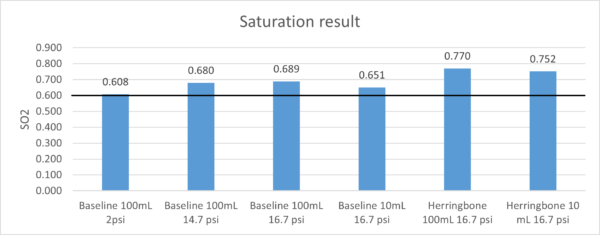
Fig. 7: Oxygenation Results. Dark line represents initial saturation level.
A varied amount of oxygen saturation increase was seen depending on blood flow rate flow rate. As one can see from the graph below, plotted on a logarithmic x-axis, the trend at the lower end of the flow rate range shows much more similar trends to the experimental cases. The lowest flow rates have the highest oxygen saturation increase. This is followed by a minimum of oxygen saturation change around 20 mL/min, then the originally seen slight increase as the flow rate goes up to 100 mL/min. Advection and diffusion contribute to the different levels with a trade-off between extra time and extra velocity. Extra mixing at high velocities helps, but more time for diffusion of oxygen through the blood also helps.
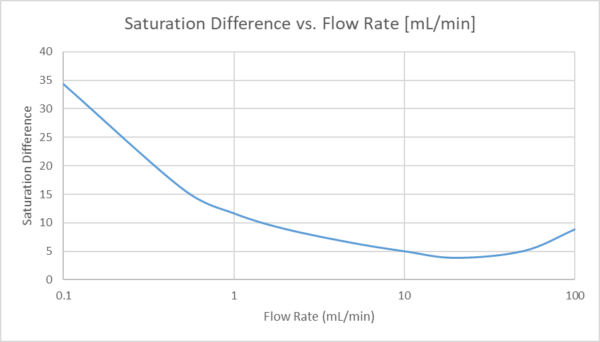
Fig. 8: O2 Saturation Increase vs. Blood Flow Rate.
The lowest flow rate has the highest percent increase in blood oxygen saturation. As one can see from the figure below, this is due to a slowly building boundary layer of high oxygen content. Once the partial pressure of oxygen of oxygen on the gas side reaches the PO2 of the plasma, the oxygen transfer is in equilibrium. From that point on, oxygen can only transfer in as the oxygen diffuses through the rest of the blood, or if fresh blood is mixed toward the membrane.
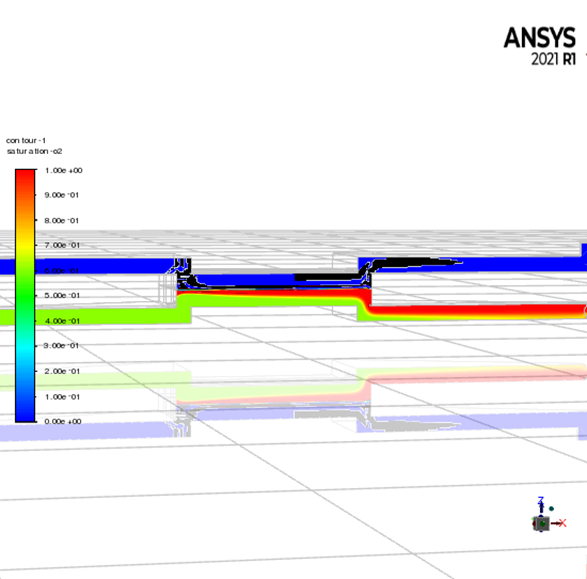
Fig. 9: 0.1mL/min saturation contours
The minimum percent increase in oxygen was found for 20 mL/min. As one can see from the contour plot, the boundary layer does not have time for diffusion to build its thickness, and therefore it diffuses very little oxygen after the initial contact of the blood with the membrane.
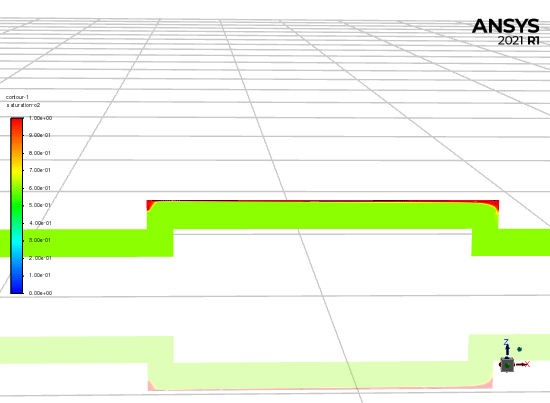
Fig. 10: 20 mL/min saturation contours
The final contour plot shows flow at 100mL/min. At this point, the percentage increase of oxygenated blood is higher. This may be due to higher Reynolds number causing higher advection and more chaotic flow. As discussed before, this is greatly improved upon when a mixing device is added.
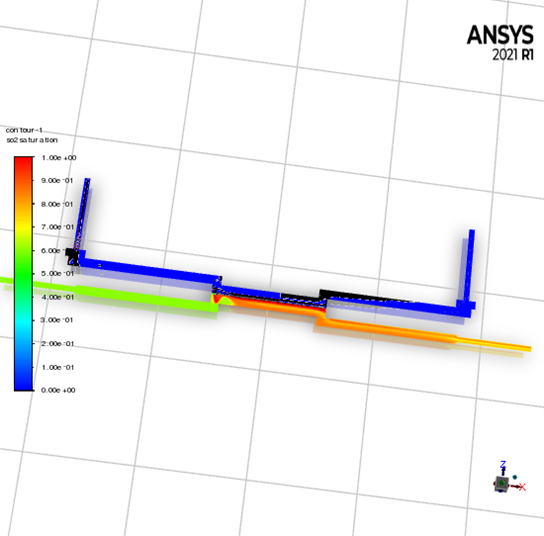
Fig. 11: 100 mL/min saturation contours
Conclusion
Advection is highly important when performing nano-membranes to diffuse urea or oxygen. Addition of mixing devices in the flow helps greatly in the overall performance of these novel ECMO/dialysis devices.
References
Poskus, Matthew D., “Numerical Model to Predict Hemolysis and Transport in a Membrane-Based Microfluidic Device” (2019). Thesis. Rochester Institute of Technology. Accessed from
https://scholarworks.rit.edu/theses/10301