Using Histogram Distance Measurements as a Means of Analyzing Flow Cytometry Data
Overview
Recently, we performed a series of flow cytometry studies assessing neutrophil (PMN) activation in first generation flow devices. All the relevant data and can be found in a previous post: here. As part of the analysis, we chose to quantify relative PMN activation by comparing isotype control histograms against L-selectin (CD62L) expression histograms. This post will detail the rationale behind this selection as well as the mathematical methods used to generate results.
Introduction
L-selectin is expressed on the ectodomain of most circulating leukocytes, including PMN’s, and is implicated in regulating PMN trafficking to inflammation. In response to inflammatory stimuli, PMN’s shed L-selectin off their membrane surface while simultaneously upregulating expression of Mac-1 (CD11b). Thus, a common marker for PMN activation in literature is +Mac-1, -L-selectin. With respect to flow cytometry, decreased expression of L-selectin in an activated neutrophil population means that staining antibodies specific for L-selectin are more likely to engage in non-specific binding. In data analysis (noting that all antibodies used are monoclonal mouse IgG1 conjugated to AF488), this manifests as an increased overlap ratio between the L-selectin and isotype control histograms, which is to say that histograms specific for L-selectin expression experience a centroid shift towards the centroid of the isotype control histogram. Given that the number of cells analyzed for both of these stained groups is roughly equal across all experimental conditions, we can make the assumption that higher degrees of activation correspond to higher overlap ratios such that “complete” or “total” activation would imply a 1:1 overlap between the two histograms. We can calculate overlap by finding the distance (or similarity) between the histograms of interest and there are a plethora of techniques available for this. For simplicity, we’ll focus on two commonly used techniques from the image processing space, the Jaccard index and the Szymkiewicz–Simpson/overlap coefficient.
Mathematics
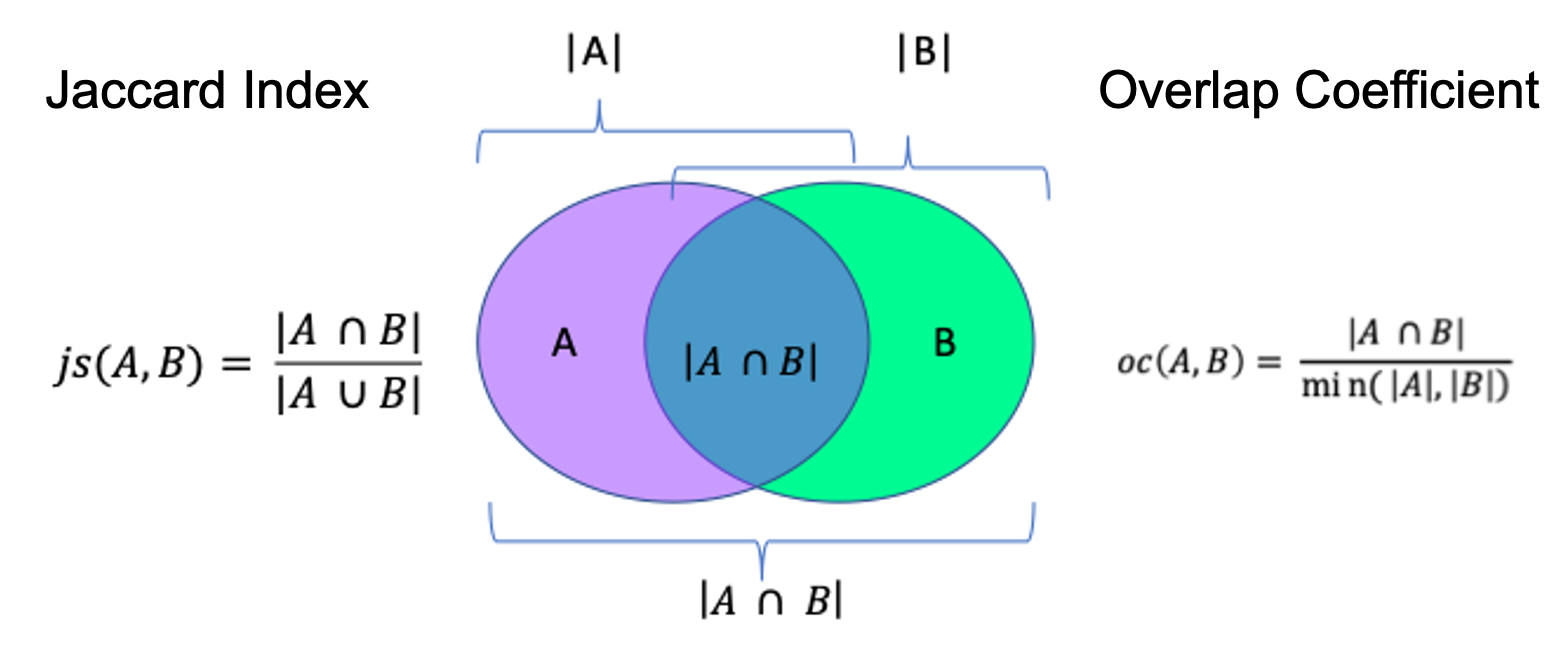
Both histogram distance measurements operate on logical principles established in Zermelo-Fraenkel set theory, a refresher of this topic can be found here. We note that the binning performed by our flow cytometer (Guava EasyCyte Mini) creates histograms that are sets with cardinality 1024. For reference, let C be the arbitrary histogram with cardinality 1024 generated from flow cytometry data and let n be be any element of C (such that n∈C) where each n is the number of detected fluorescent events. Using this structure, we let A be the histogram that represents isotype control data and let B be the histogram that represents L-selectin data for a given experimental condition. Then, the Jaccard index is defined as:
|A ∩ B| / |A U B|
And the Overlap coefficient is:
|A ∩ B| / min(|A|, |B|)
Using these relationships, we can then calculate the relative activation ratios of neutrophils extracted from a flow cell.
Results
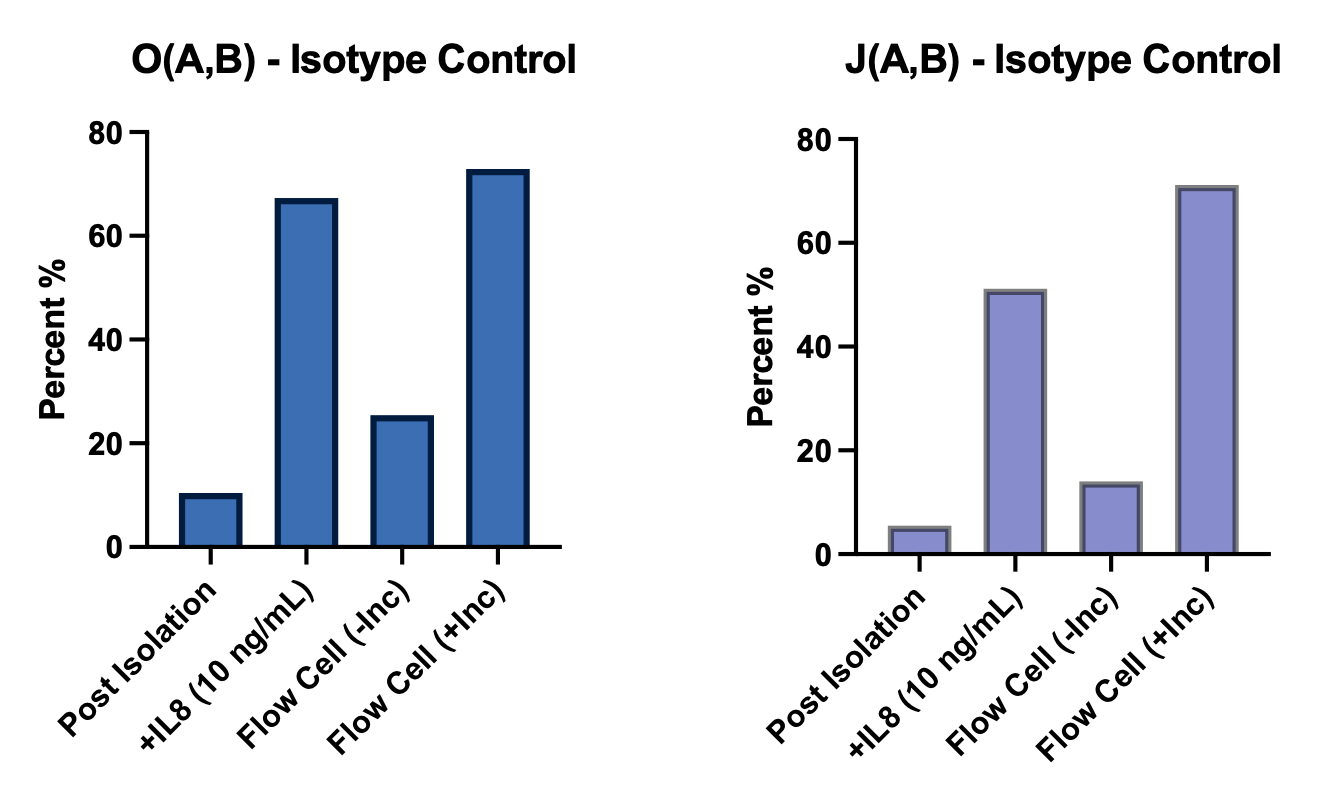
We found that there is little difference between calculating the jaccard index versus overlap coefficient (Figure 2). Given that the jaccard index is less sensitive to sample size, we chose to use this measurement moving forwards.
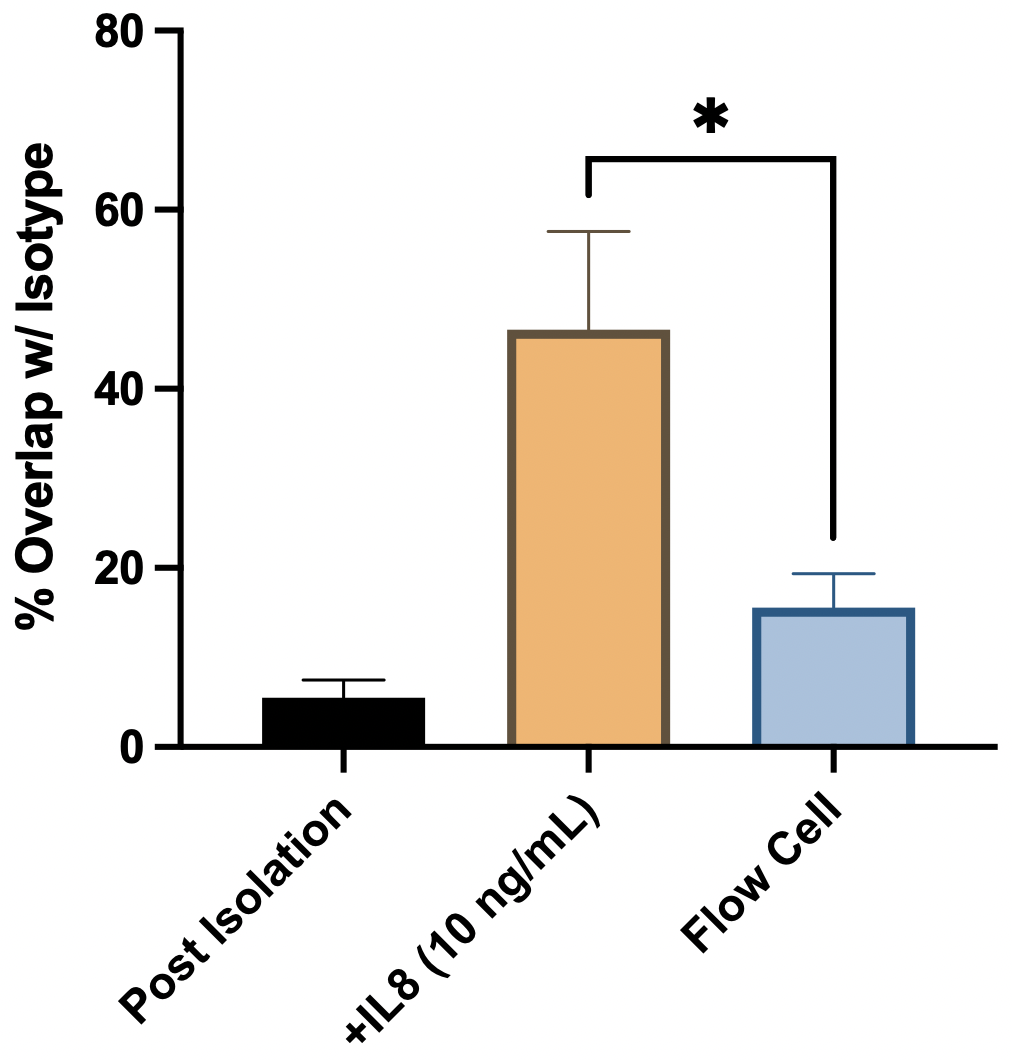
Applying jaccard measurements to n = 4 datasets reveals that post isolation neutrophils suspended in wash buffer are roughly 5.5% activated, compared to 46.6% for +IL8, and 15.6% for the flow cell (Figure 3). The post isolation results are not significantly different when compared to the flow cell group, while the flow cell group is significantly different from the positive control.
Conclusion
From these results, we see that the flow cell does not significantly activate neutrophils compared to the negative control and we achieve a benchmark of activation (~10% versus control). We plan on utilizing a different analysis for Mac1 histograms noting that histogram distance measurements are insufficient for measuring relative up-regulation.