pedELISA sensing on diffusion limited cytokines in uSIM
Introduction
The ability to continuously sample and assay for the levels of soluble factors without disrupting the microenvironment is important to acquire sequential secretion profiles in BBB experiments on an uSIM module. Combining small volume sampling, buffer replenishment and sensitive pedELISA technology would enable longitudinal assays of proteins introduced to blood compartment or released from cells. The pedELISA technology features combining digital molecular counting concept (Fig.1) and microfluidic spatial encoding method to achieve multiplexed detection of proteins with sample volume as low as 2ul and 0.1-1pg/ml of LOD depending on the affinity of the analyte. With the smallest compartment volume of the uSIM at 20ul, less than 10% of the volume can be sampled to acquire a full protein profile and ensure minimum disruption to the microenvironment on a chip.
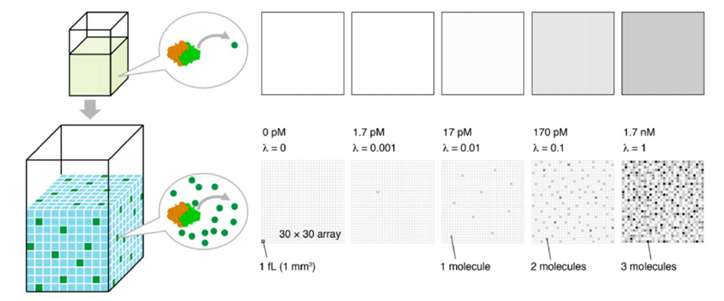
Figure 1. The digital molecular counting concept partitions the bulk media and utilizes Poisson statistics to obtain better sensitivity across a larger dynamic range as compared to traditional analog assays. [1]
However, sampling small volumes that is representative to the concentration around the BBB membrane area on the chip, can be quite challenging as our previous experiments as well as finite element analysis (Fig.2) have shown that even after 18-24hrs of pure diffusion in 37°C, the distribution of cytokines across the microfluidic device remain ununiform and the solutions taken from the in/outlet will mainly be diluted solutions with little characteristic cell secretion information in the device. This post aims to have a preliminary understanding on cytokine diffusion across the nano-porous membrane and through the bottom channel of the uSIM device which would be valuable in assessing and designing sufficient mixing method inside a laminar flow dominating microfluidic channel.
Figure 2. COMSOL simulation of TNFa cytokine diffusion profile and concentration distribution after laminar inflow into our microfluidic cellular immunophenotyping device (MIPA). (The time change on the top figure is wrong due to a software display bug, the actual time elapsed is 18 hours.)
Method
1. Sample preparation
Five uSIM devices were all assembled in a trench-up setup and the bottom channels were first loaded with 20ul of DMEM medium without the formation of bubbles. The top reservoirs were then loaded with either 1000pg/ml, 200pg/ml, 40pg/ml, or 8pg/ml of mouse TNFa reconstituted in DMEM. One of the devices were loaded with food dye and no cytokines for flow visualization. The devices were first sealed in a moisturized Petri dish and incubated in a cell culture incubator set at 37°C, 5% CO2 for 20hrs. Three different methods of sampling per device were carried out post incubation: 1) Adding 2ul of DMEM to an inlet and take 2ul out from the outlet. 2) Adding 2ul of DMEM to an inlet, pipette mixing 30 times with 2ul volume, then extract 2ul of sample from the outlet. 3) Extract all solution out of the device. The cytokine containing samples were then stored at -80°C for pedELISA measurements.
2. pedELISA measurement
Multiplex digital sensing is carried out using microfluidic patterning of capture antibody coated microbeads into soft lithography fabricated microwells. (Fig. 3) The patterning layer are then replaced with a sample layer to perform parallel multiplexed measurements of samples. The size and pitch of the microwells and their arrays are engineered and designed to retain the trapped beads to ensure minimum cross contamination while ensuring a high information density for low sample volume measurement. For better accessibility and to minimize human error that could for example cause variations in incubation time differences across samples, automated CNC assay/readout systems are utilized. (Fig.4)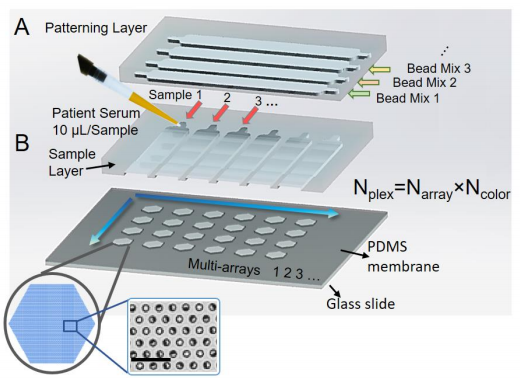
Figure 3. Schematic of spatially/spectrally encoded multiplexed pedELISA [2]
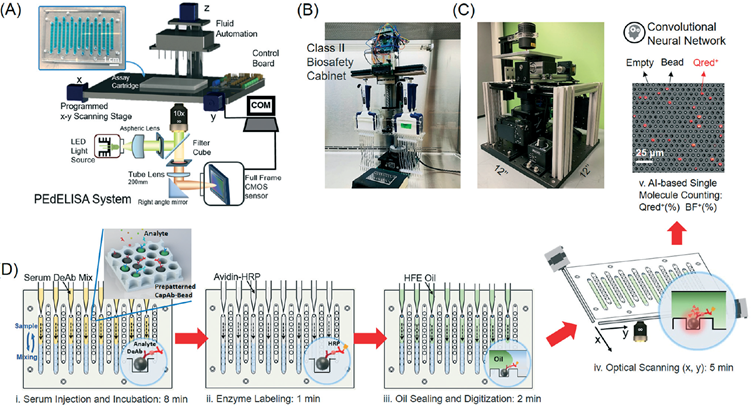
Figure 4. (A, B, C) Automated pedELISA system setup (D)Automated processes including labeling, bulk media partitioning and signal readout [3]
Results and Discussions
The blue food dye test was carried out for mixing visualization and would not be representative of the concentration distribution profile due to the difference in diffusion coefficients. After 20 hrs of incubation under 37°C, the dye from the top reservoir diffused into the bottom channel and was well dispersed without mixing. (Fig. 5A) An additional 2ul of concentrated food dye was added to a inlet and 2ul of pipette mixing was done on the other end of the device and the mixing failed to come to a new uniform equilibrium indicating the mixing was insufficient in the laminar flow dominated structure.
Cytokine concentrations measured through pedELISA are shown in (Fig. 5 B, C) With the 2ul sample concentration taken out from 1000pg/ml with/without mixing and 200pg/ml with/without mixing to be 295.9pg/ml, 562.4pg/ml, 63.0pg/ml, 12.7pg/ml, respectively. The results showed a ~3X dilution primary owing to the diffusion limitation through the nanopores and the channels. In the 1000pg/ml samples the mixed sample has a lower concentration at ~300pg/ml while in the 200pg/ml samples, the mixed sample has a higher concentration of ~60pg/ml. The different trend may be due to unexpected convection due to the pressure difference created by different sizes of the droplets at the in/outlets of the device.
Whole extraction sample measurements and further replicate experiments are needed to assess the mixing efficiency and if the exact 5X difference (300pg/ml and 60pg/ml) from the mixed 1000pg/ml and 200pg/ml samples is due to coincidence. 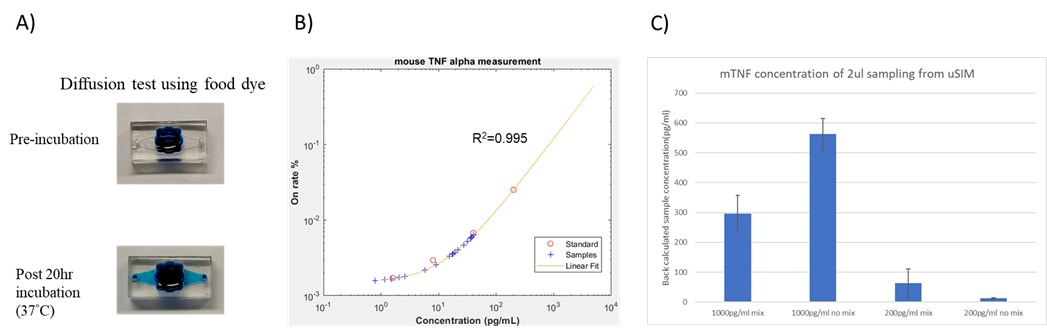
Figure 5. (A) Food dye test for diffusion and flow visualization (B, C) Cytokine concentration measurement of samples using the pedELISA platform
References
[1] D. M. Rissin, C. W. Kan, T. G. Campbell, S. C. Howes, D. R. Fournier, L. Song, T. Piech, P. P. Patel, L. Chang, A. J. Rivnak, E. P. Ferrell, J. D. Randall, G. K. Provuncher, D. R. Walt, and D. C. Duffy, “Single-molecule enzyme-linked immunosorbent assay detects serum proteins at subfemtomolar concentrations,” Nature Biotechnology, vol. 28, no. 6, pp. 595–599, 2010.
[2] Y. Song, Ultrafast Microfluidic Immunoassays Towards Real-time Intervention of Cytokine Storms, PhD thesis, https://deepblue.lib.umich.edu/handle/2027.42/163129
[3] Y. Song et al., A digital protein microarray for COVID-19
cytokine storm monitoring, Lab Chip, 2020, 00, 1–13, DOI: 10.1039/d0lc00678e