IMR90-4 EECM-BMEC-like Cell Analysis in µSiMs
Introduction
We are differentiating and validating EECM-BMEC (Extended Endothelial Cell Culture Method-Brain Microvascular Endothelial Cell)-like cells in µSiM devices. See this post and this post for method details and validation in traditional cell culturing platforms.
Methods
Attempt 1 – Overstimulated cells
IMR90-4 iPSC EECM-BMEC P3 frozen vial was thawed. At P4 cells were seeded and cultured 2 days in µSiMs (NPSN) and 5 days in Transwells (0.4 µm PC, 12 well format). Cells were stimulated with 1 ng/ml TNFa/IFNg for 16 hours and then assayed. Assays include in situ and sampling method permeability and staining for cell adhesion molecules.
Attempt 2 – Properly stimulated cells
IMR90-4 iPSC EECM-BMEC P4 frozen vial was thawed. At P5 cells were seeded and cultured 1 day in µSiMs (NPSN) and 5 days in Transwells(0.4 µm PC, 12 well format). Transwells were seeded at ¾ their usual seeding density. Cells were stimulated with 0.1 ng/ml TNFa/IFNg for µSiM devices or 1 ng/ml TNFa/IFNg for Transwells for 16 hours and then assayed. Assays include in situ and sampling method permeability and staining for cell adhesion molecules. In addition, cells were seeded in NPSN and Hybrid (3 µm, 0.625% and 1.25% micropore density) for proof-of-concept neutrophil transmigration analysis. The plan was to only use 0.625% membranes, but there was a device in the gel box that was 1.25%, and we did not check membranes for accuracy prior to cell seeding. For the assay, Dan isolated neutrophils with his usual protocol. A flow cell was added to the top well prior to neutrophil addition to obtain a flat imaging plane. fMLP was used to draw neutrophils across the endothelial layer, and devices were maintained in an incubation chamber during imaging. After a 30 min incubation, neutrophils were collected from the bottom chamber of hybrid membrane devices and counted. A 20 µl reservoir was added to one port and two 10 µl samples were taken and transferred to a hemocytometer for counting.
Results
Attempt 1 – Overstimulated cells
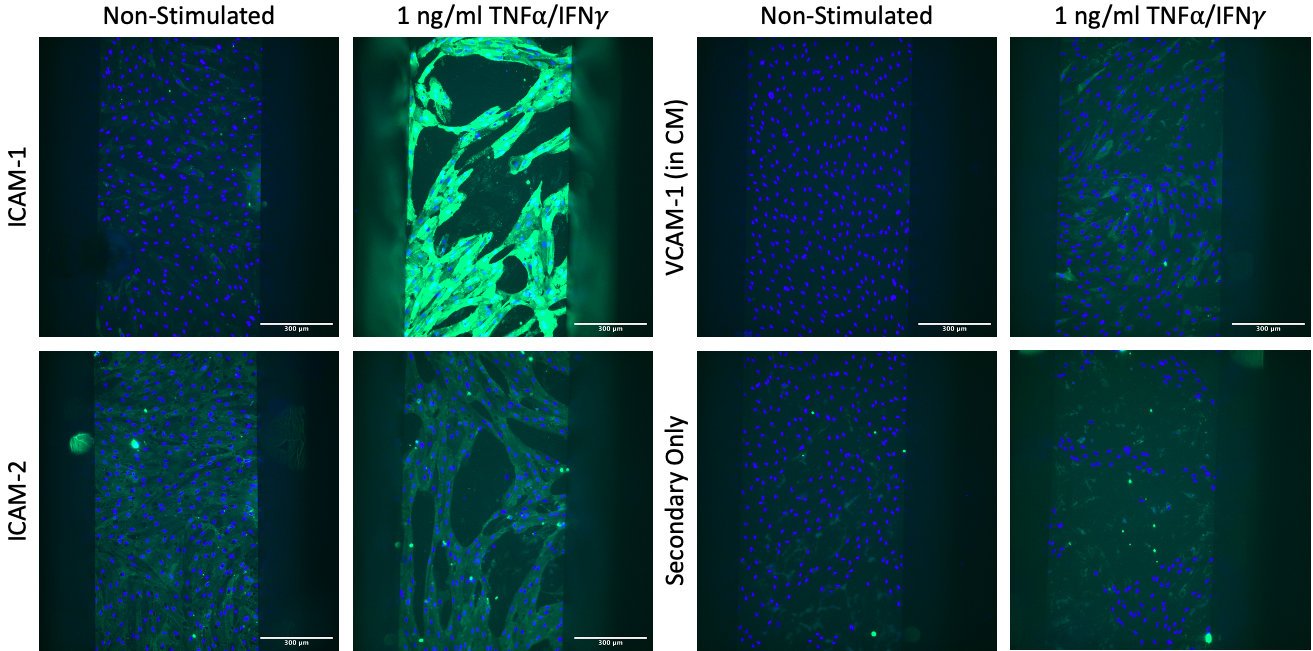

Stimulation of 1 ng/ml TNFa/IFNg in µSiM devices leads to receding of cell monolayer. This means we cannot do permeability assays. Regardless, we see expected upregulation of ICAM-1 and VCAM-1, and constitutive expression of ICAM-2. (CM = smooth muscle-like cell conditioned medium; Top: Scalebar = 300 µm, Bottom: Scalebar = 100 µm; n = 1-2 per condition).

I ran permeability experiments on non-stimulated cells in µSiMs. The in situ assay was analyzed using an older method (100, not 133 µm, for x in flux equation). I can reanalyze if needed, but do not plan on using this data, since I do not have corresponding stimulated data. It is likely the reanalysis would slightly decrease the permeability values for both, bringing unhindered D values more in-line with sampling data. Importantly, sampling data falls around previous and current non-stimulated Transwell data. This is still higher than our ultimate goal, but consistent with published data from Nishihara et al, FASEB, 2020 Supplemental Data. Interestingly, stimulated Transwell cells did not increase permeability at all. This is consistent with work from Bern, but specific to IMR90-4.

Above is ZO-1 staining of Transwells. According to Pelin, Transwells may be over-confluent. Because of this, I will reduce seeding density in the next attempt. (Scalebar = 300 µm).
Attempt 2 – Properly stimulated cells
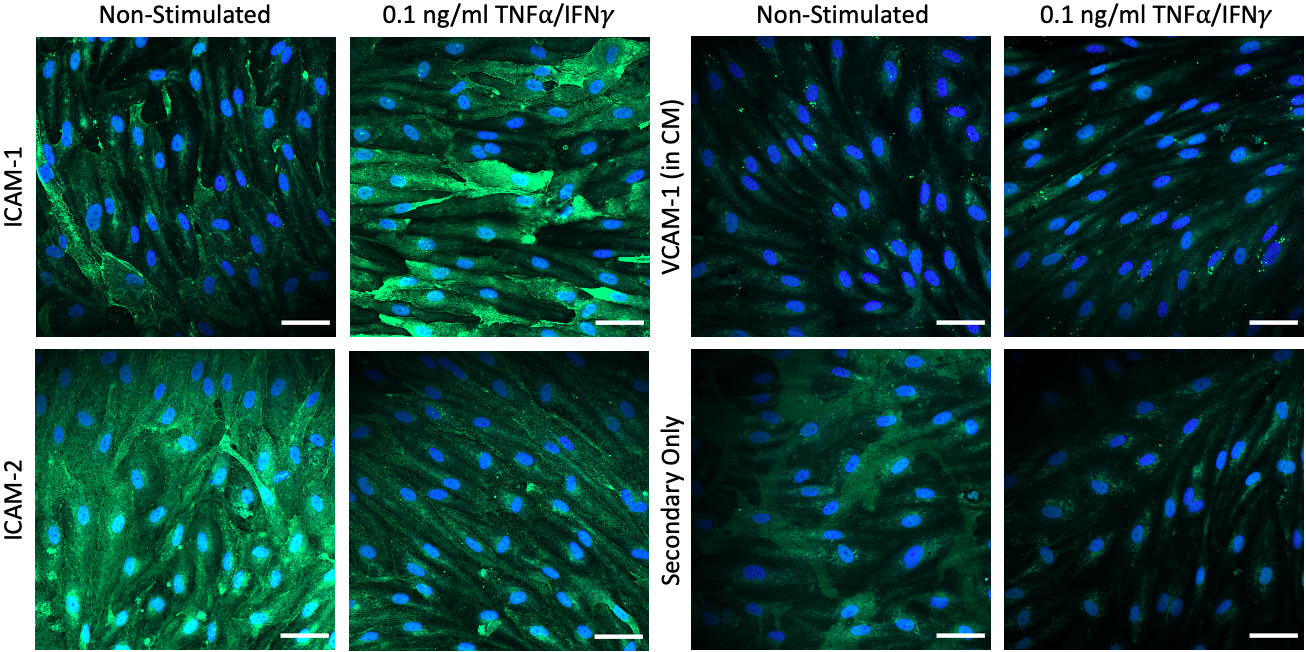
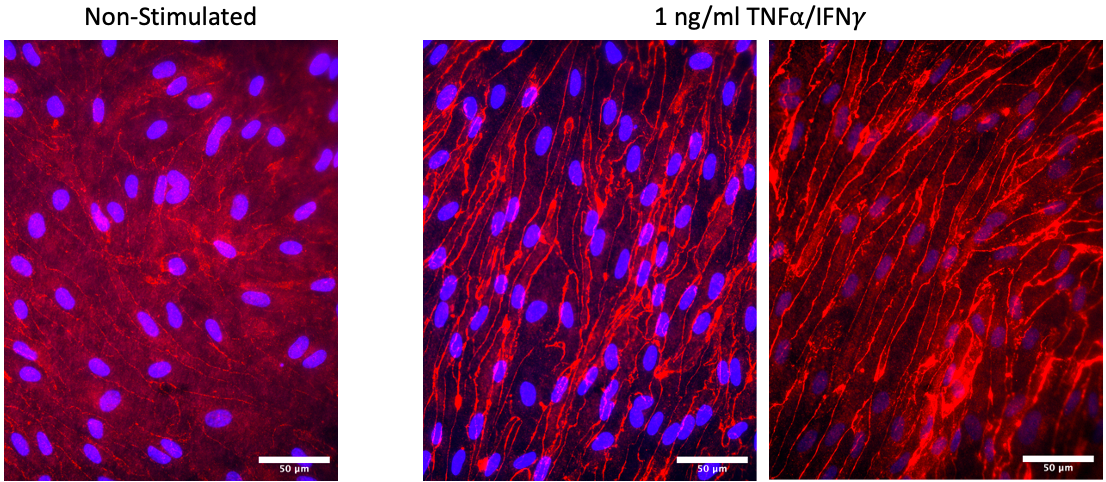
Stimulation of 0.1 ng/ml TNFa/IFNg in µSiMs maintains confluent cell monolayers. It appears we still see expected upregulation of ICAM-1 and VCAM-1, and constitutive expression of ICAM-2. (CM = smooth muscle-like cell conditioned medium; Scalebar = 50 µm; n = 2 per condition).
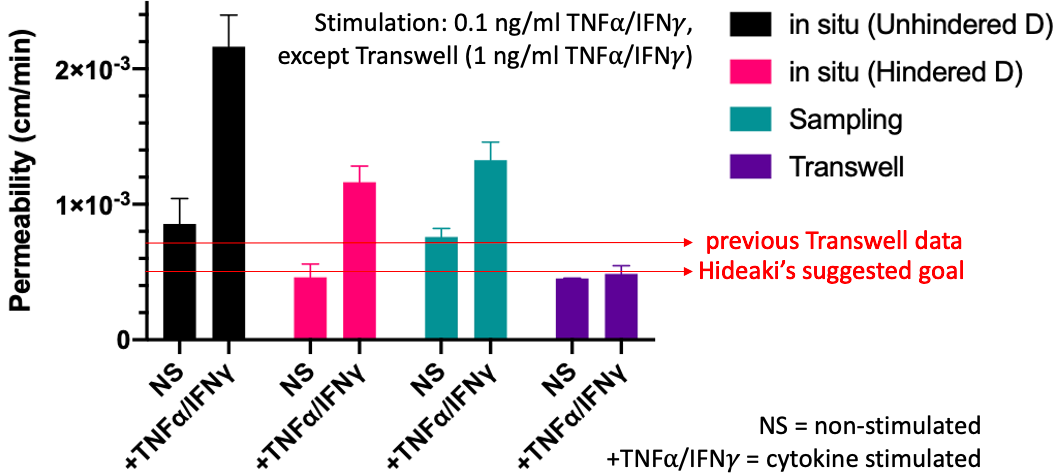
We see increased permeability in µSiMs in response to cytokines (0.1 ng/ml TNFa/IFNg) using both the in situ and sampling permeability methods (2-way ANOVA, n = 3 per condition). While there is no significant difference between NS all methods in µSiM, the stimulated in situ µSiMs analyzed with the unhindered D is significantly higher than when analyzed with the hindered D and data from the sampling method. For more discussion on this, please see this post.
Non-stimulated µSiM permeability is still in-line with previous non-stimulated Transwell data and published data from Nishihara et al, FASEB, 2020, Supplemental Data, possibly on the higher end. However, the µSiMs were seeded with the standard 15,000 cells/device. Due to apparent over-confluency of Transwells, I reduced the seeding density in Transwells to ¾ of the standard 1.12 x 10⁵ cells/filter. Excitingly, this lowered the permeability to our goal of 0.5 x 10⁻³ cm/min! I will next try reducing seeding density in devices to see if we can improve µSiM permeability. We still did not see an increase with cytokine stimulation in Transwell, but Pelin is working on troubleshooting this.
Representative images of Transwell ZO-1 stains. (Scalebar = 50 µm).

We were able to successfully image neutrophils transmigrating across the endothelial layer cultured on an NPSN membrane. The neutrophil goes from phase-bright to phase-dark. Interestingly, the addition of the flow cell with the NPSN membranes caused the endothelial cells to retract, which we believe is due to a pressure differential. They healed over time, but we did have large gaps in the monolayer during the assays (n = 2 for NPSN).

We were also able to successfully image neutrophils transmigrating across the endothelial layer cultured on a hybrid membrane, 1.25% micropore density, as well as image it crawling through a micropore. The neutrophil goes from phase-bright to phase-dark when migrating across the endothelial layer and back to phase-bright, but with a halo, after migrating through a micropore. Interestingly, the addition of the flow cell with the hybrid membranes did not disrupt the endothelial monolayer. We believe the micropores relieve the pressure differential. (n = 1 for Hybrid 3 µm, 1.25%).

Similarly, we were able to successfully image neutrophils transmigrating across the endothelial layer cultured on a hybrid membrane, 0.625% micropore density, as well as image it crawling through a micropore. Again, the neutrophil goes from phase-bright to phase-dark when migrating across the endothelial layer and back to phase-bright, but with a halo, after migrating through a micropore. (n = 2 for Hybrid 3 µm, 0.625%).
| Sample | Device 32, 1.25% | Device 33, 0.625% | Device 34, 0.625% |
| First Wash Count | 51 | 10 | 26 |
| Second Wash Count | 24 | 11 | 13 |
| Total Count | 75 | 21 | 39 |
There is likely a better way to quantify, but I tried just counting everything that was on the hemocytometer to get a total count of neutrophils recovered. I did not try a third wash in any of the devices, meaning some cells may have been left behind. We will be using Dan’s coding solution to quantify transmigration in the future, so this is really a proof of concept that we can collect immune cells and potentially perform downstream analysis. While the imaging looks better on the lower, 0.625% density micropore hybrid chips, we seem to have a higher recovery from the higher, 1.25% density micropore hybrid chips. Therefore, the pore density chosen may depend on how many transmigrated cells the user needs for downstream analysis.
Finally, I want to note that, while all endothelial monolayers reached confluency after 2 days of culture, the cells grown on hybrid membranes grew slower than their NPSN counterparts.
Conclusions
- For IMR90-4 EECM-BMECs, 0.1 ng/ml TNFa/IFNg is sufficient to induce increased permeability of cells grown in µSiMs. 1 ng/ml TNFa/IFNg is too high stimulation for µSiMs, but is unable to cause increased permeability of cells grown on Transwells.
- Likely due to counting or sampling differences compared to Bern, lowering the seeding density on Transwells improves permeability to our goal of 0.5 x 103 cm/min. I will repeat this in µSiMs, to see if I can improve baseline permeability in µSiM devices.
- We have, or are very close to having, publication quality images demonstrating upregulation of ICAM-1 and VCAM-1 on cells cultured in µSiMs when stimulated with 0.1 ng/ml TNFa/IFNg, as well as constitutive expression ICAM-2.
- We were able to get proof-of-concept videos of neutrophil transmigration across NPSN and hybrid membranes.
- For migration experiments, addition of the flow cell is only problematic on NPSN devices, and the cells may need an hour of recovery time prior to experimentation if used in the future.
- For hybrid pore densities, there is a tradeoff between imaging and neutrophil recovery. Higher pore density, while looking worse to the eye, allows higher neutrophil recovery from the channel. Conversely, lower pore density, while looking better, had lower numbers of neutrophils collected from the channel. It should be noted, however, that the code to analyse transmigration will work for both pore densities, so this is only a visual preference.