10 kDa Small Molecule Permeability Optimization
Introduction
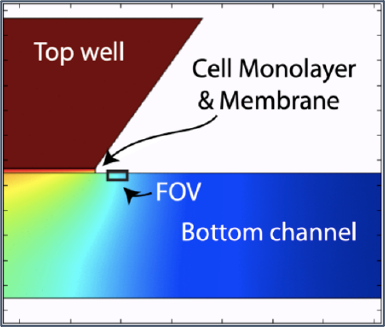
A healthy blood-brain barrier is not permissive to most small molecules, but during inflammation, tight junctions weaken and the barrier becomes more permissive. We have developed an in situ permeability assay that tracks diffusion across a cell monolayer and membrane and into the bottom channel of the µSiM device. The assay tracks a fluorescent molecule over the course of ten minutes, and the change in intensity in a control space over time is fit to COMSOL-simulated curves to determine monolayer permeability.
I have been adapting this assay to track 10 kDa FITC-dextran across an hCMEC/D3 monolayer using the Andor Dragonfly Confocal Microscope. Here, I will show the results for optimizing dye concentration and exposure time.

Methods and Results
Concentration
The bottom channel of devices were flooded with 0.5 mg/ml or 1 mg/ml FITC-Dextran (Sigma) and a snap was taken, focused 100 µm below the membrane. Exposure time was 50 ms or 100 ms. Intensity at the center of the membrane was measured using ImageJ.

Exposure Time
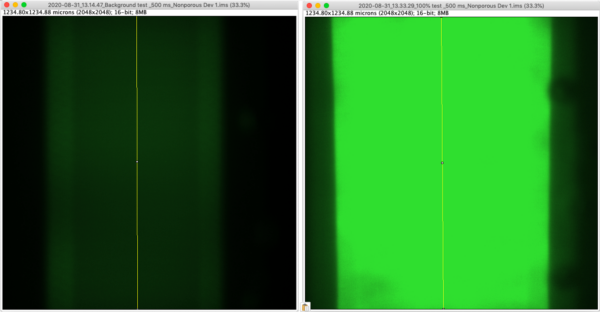
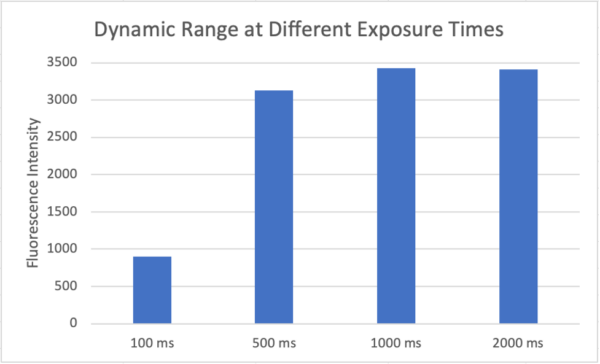
The dynamic range for different exposure times was determined. Initially 1 mg/ml 10 kDa FITC-Dextran was added to the well of a nonporous µSiM device and a snap was taken, focused 100 µm below the membrane. Then the bottom channel was flooded with 1 mg/ml FITC-Dextran and a snap was taken, focused 100 µm below the membrane. Fluorescence intensity was measured along the center of the membrane and background intensity was subtracted from maximum intensity to calculate dynamic range.
Photobleaching
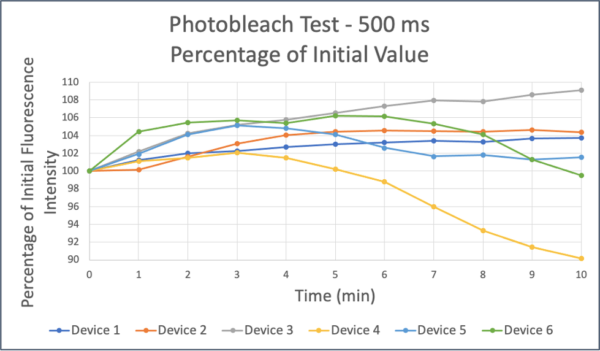
Photobleaching over the course of the experiment was tested. 1 mg/ml 10 kDa FITC-Dextran was added to the top well of a nonporous µSiM devices and 0.1 mg/ml was added to the bottom channel. Images were taken every minute for 10 min, focused 100 µm below membrane, with 500 ms exposure.
Diffusion across an hCMEC/D3 Confluent Monolayer
hCMEC/D3 were seeded on collagen type 1/fibronectin-coated m-μSiM devices at 40,000 cells/cm2 and grown for 13-15 days. 1 mg/ml 10 kDa FITC-Dextran was added to the well and diffusion across the monolayer was recorded for ten minutes, with images taken every minute. Imaging was focused 100 µm below the membrane, with 500 ms exposure time. Then 1 mg/ml 10 kDa FITC-Dextran was added to the bottom channel and a snap was taken. Fluorescence intensity was measured along the center of the membrane and normalized to the intensity of the source concentration.

Conclusions
We have optimized diffusion of 10 kDa FITC-Dextran across trench-down devices on the Andor Dragonfly Confocal Microscope. Dye concentration of 1 mg/ml as selected, with exposure time of 500 ms to maximize the dynamic range without seeing photobleaching. Using these parameters, we see consistent diffusion across an hCMEC/D3 monolayer. We still need to determine monolayer permeability based on this diffusion to see if it is within the expected range for the cell line.