Here, I will post figure drafts for the paper that introduces the modular µSiM (m-µSiM).
Figures
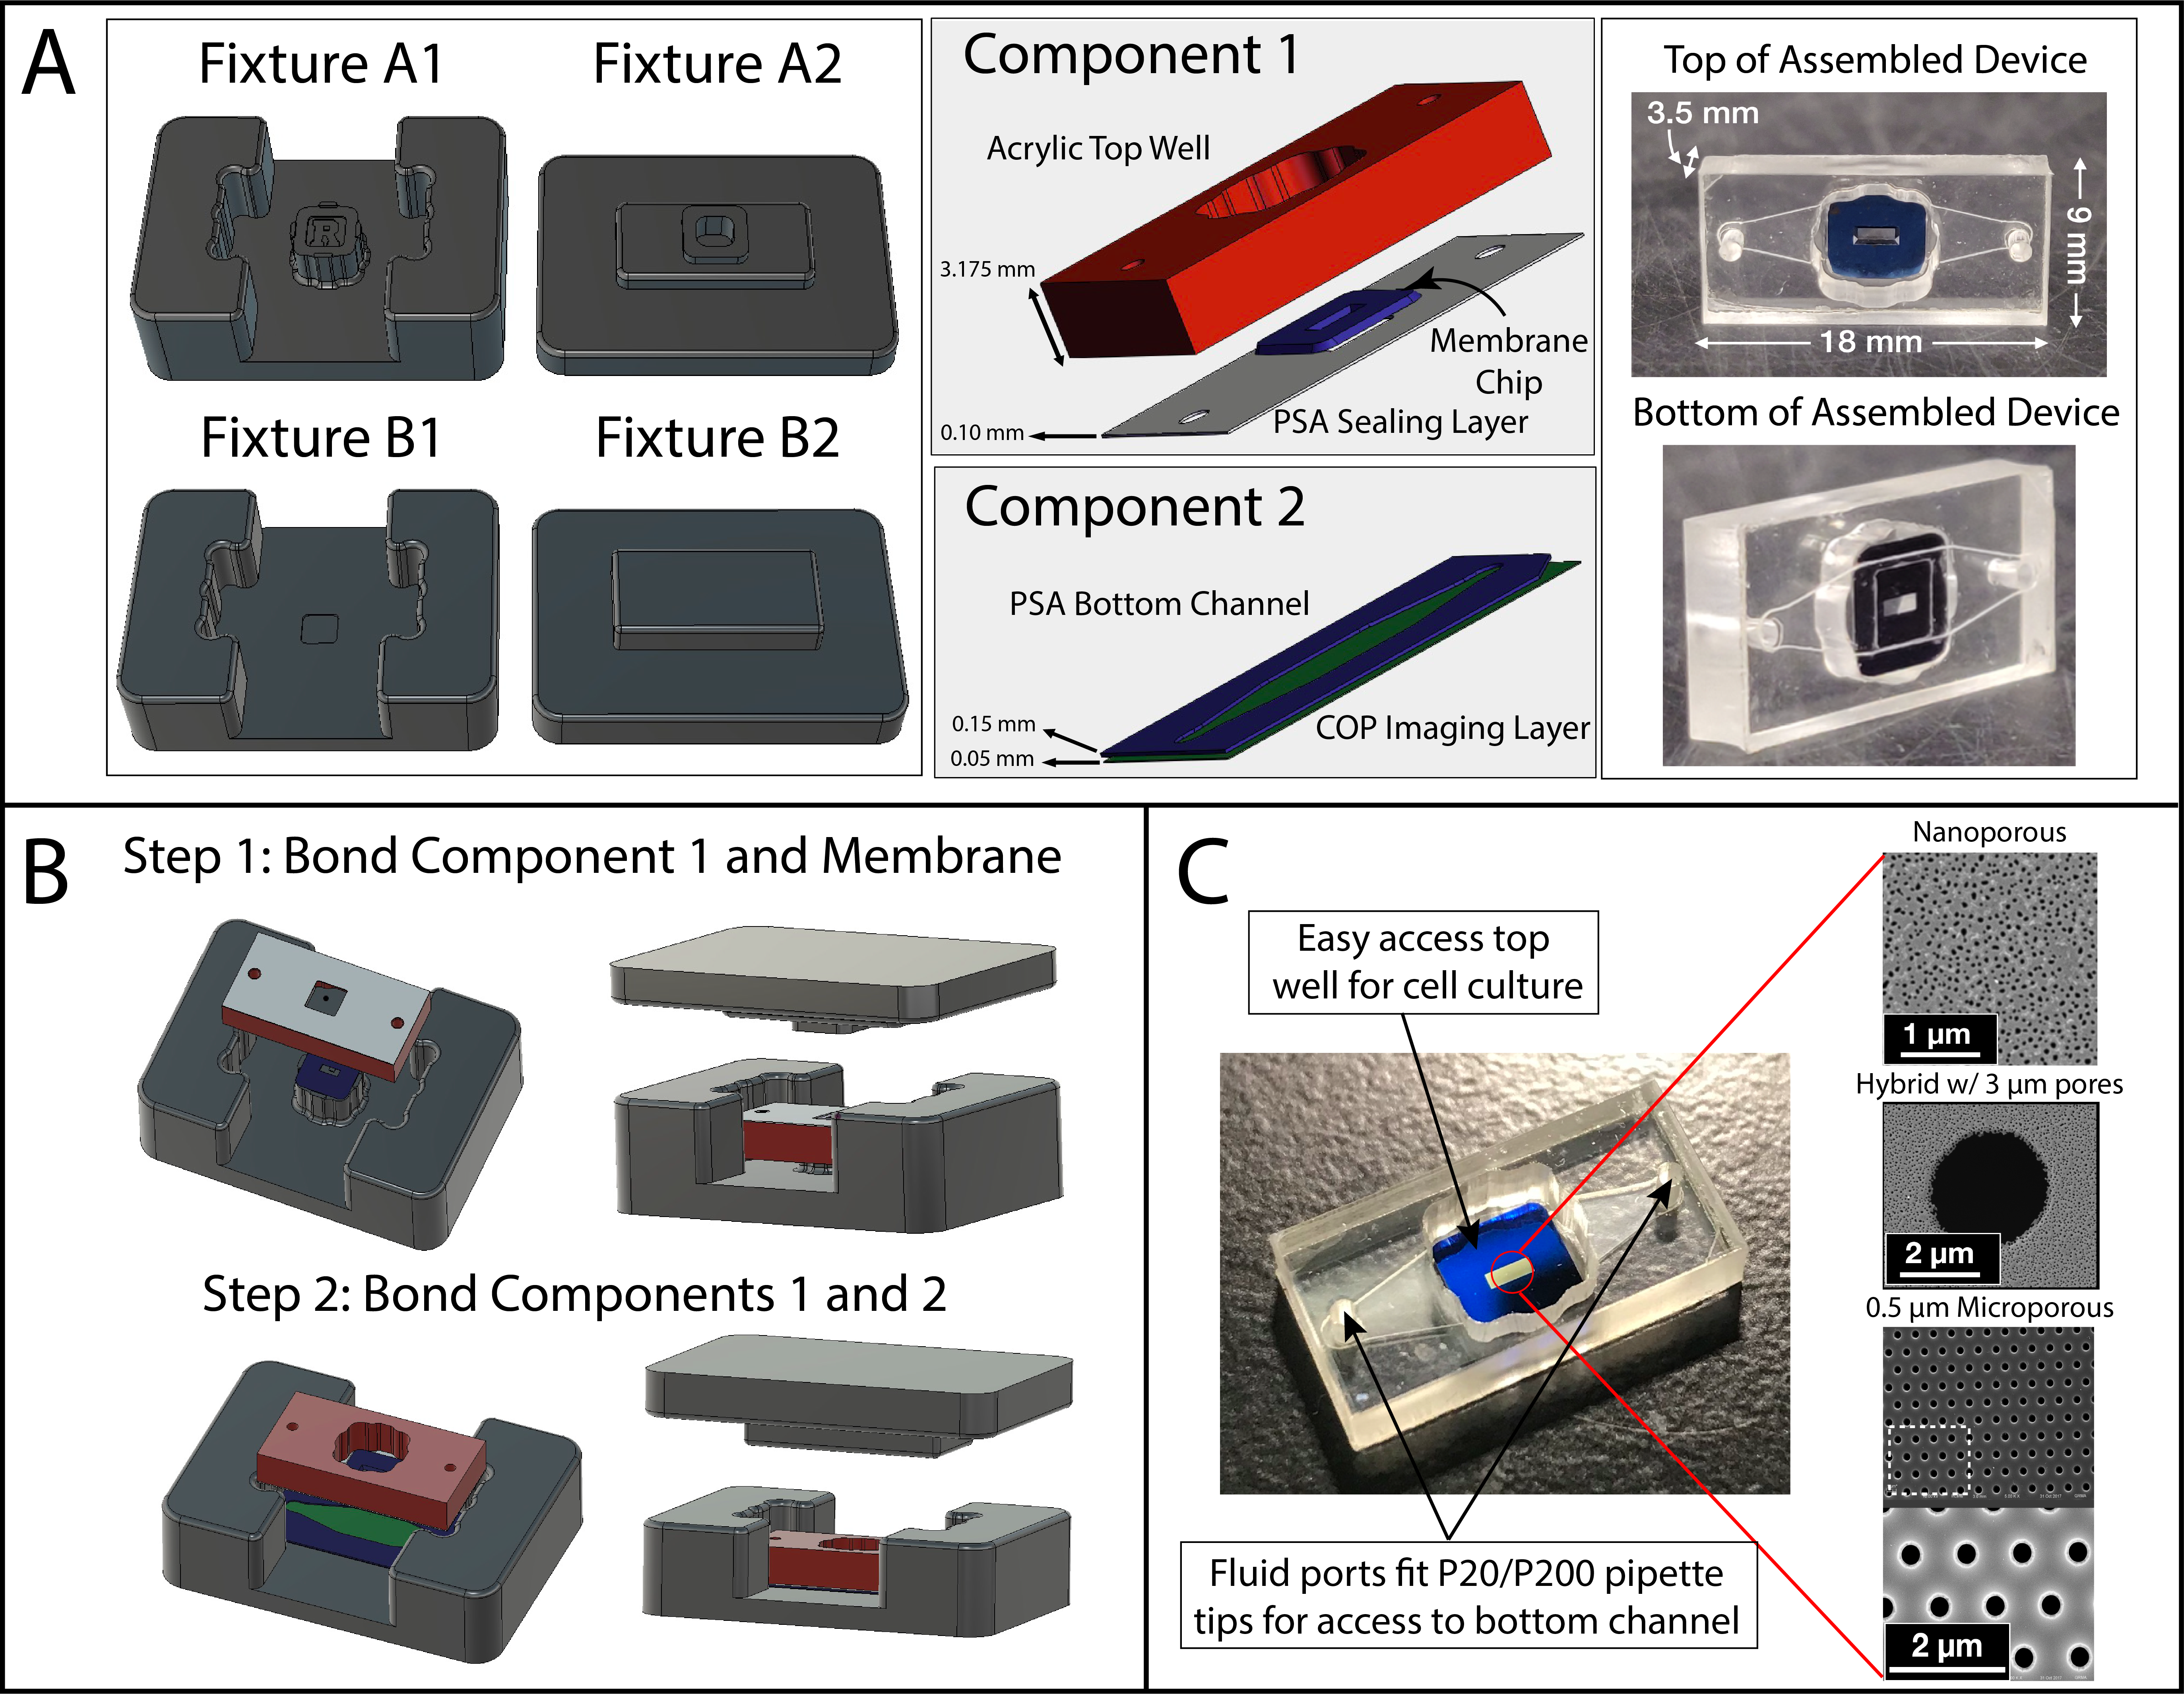
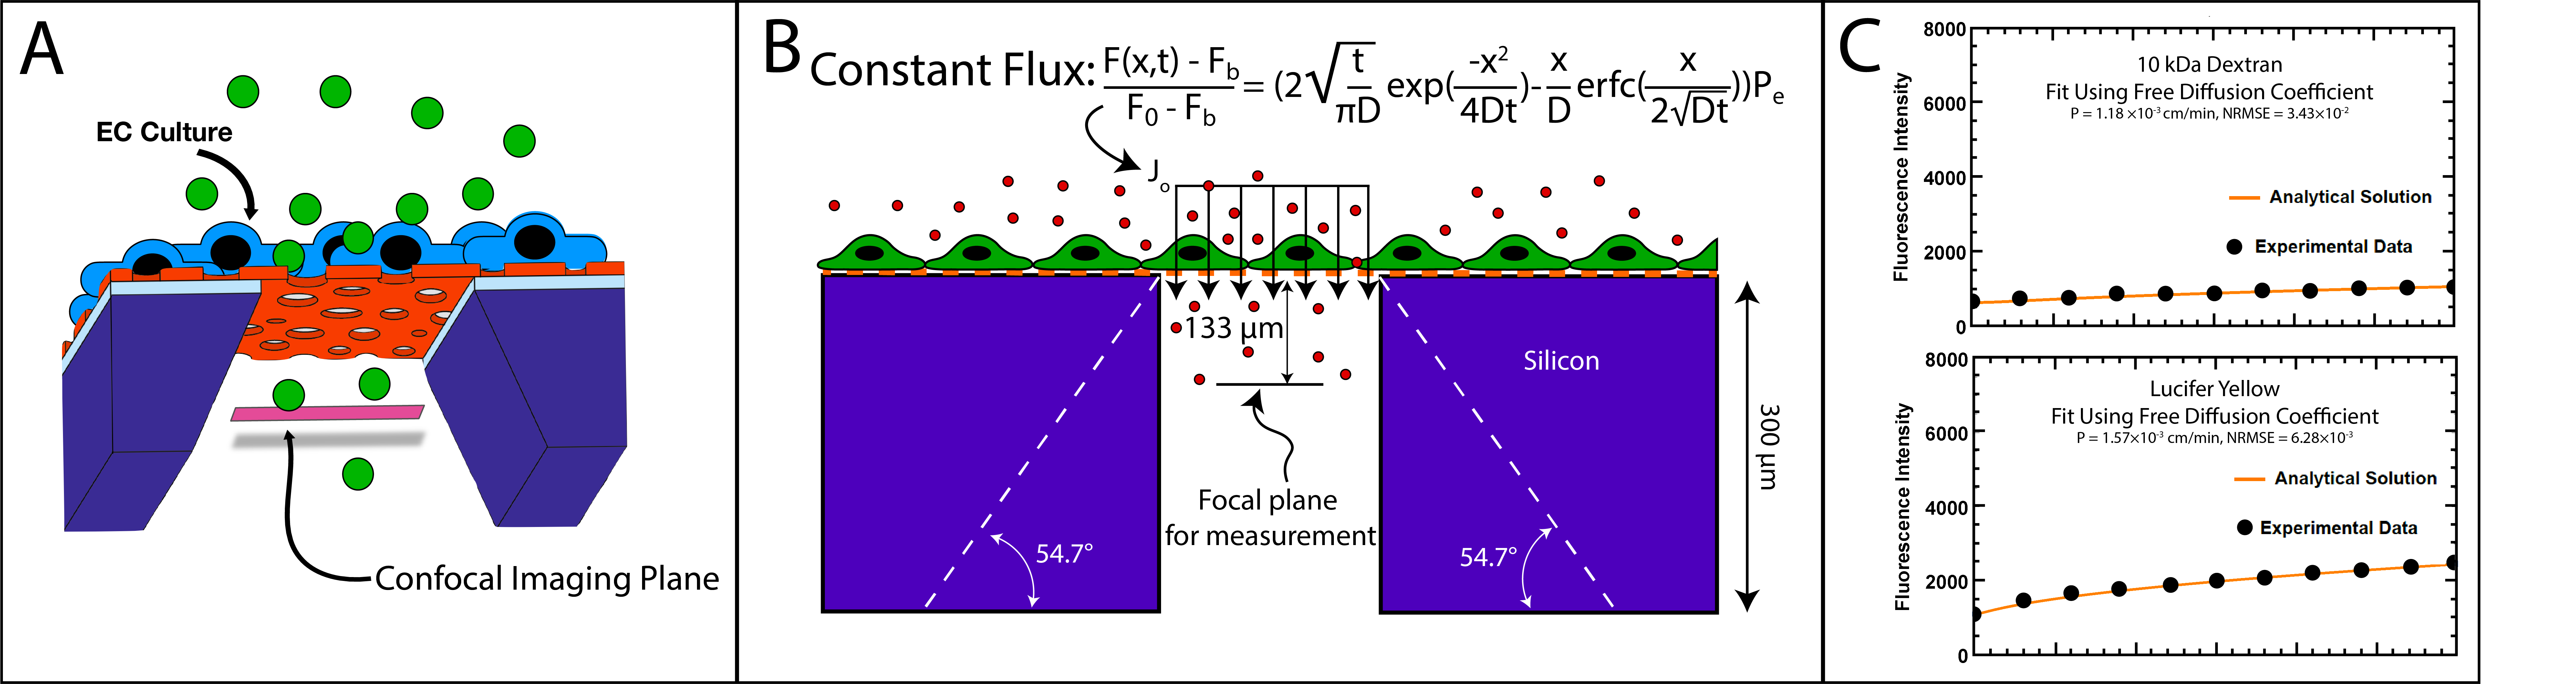
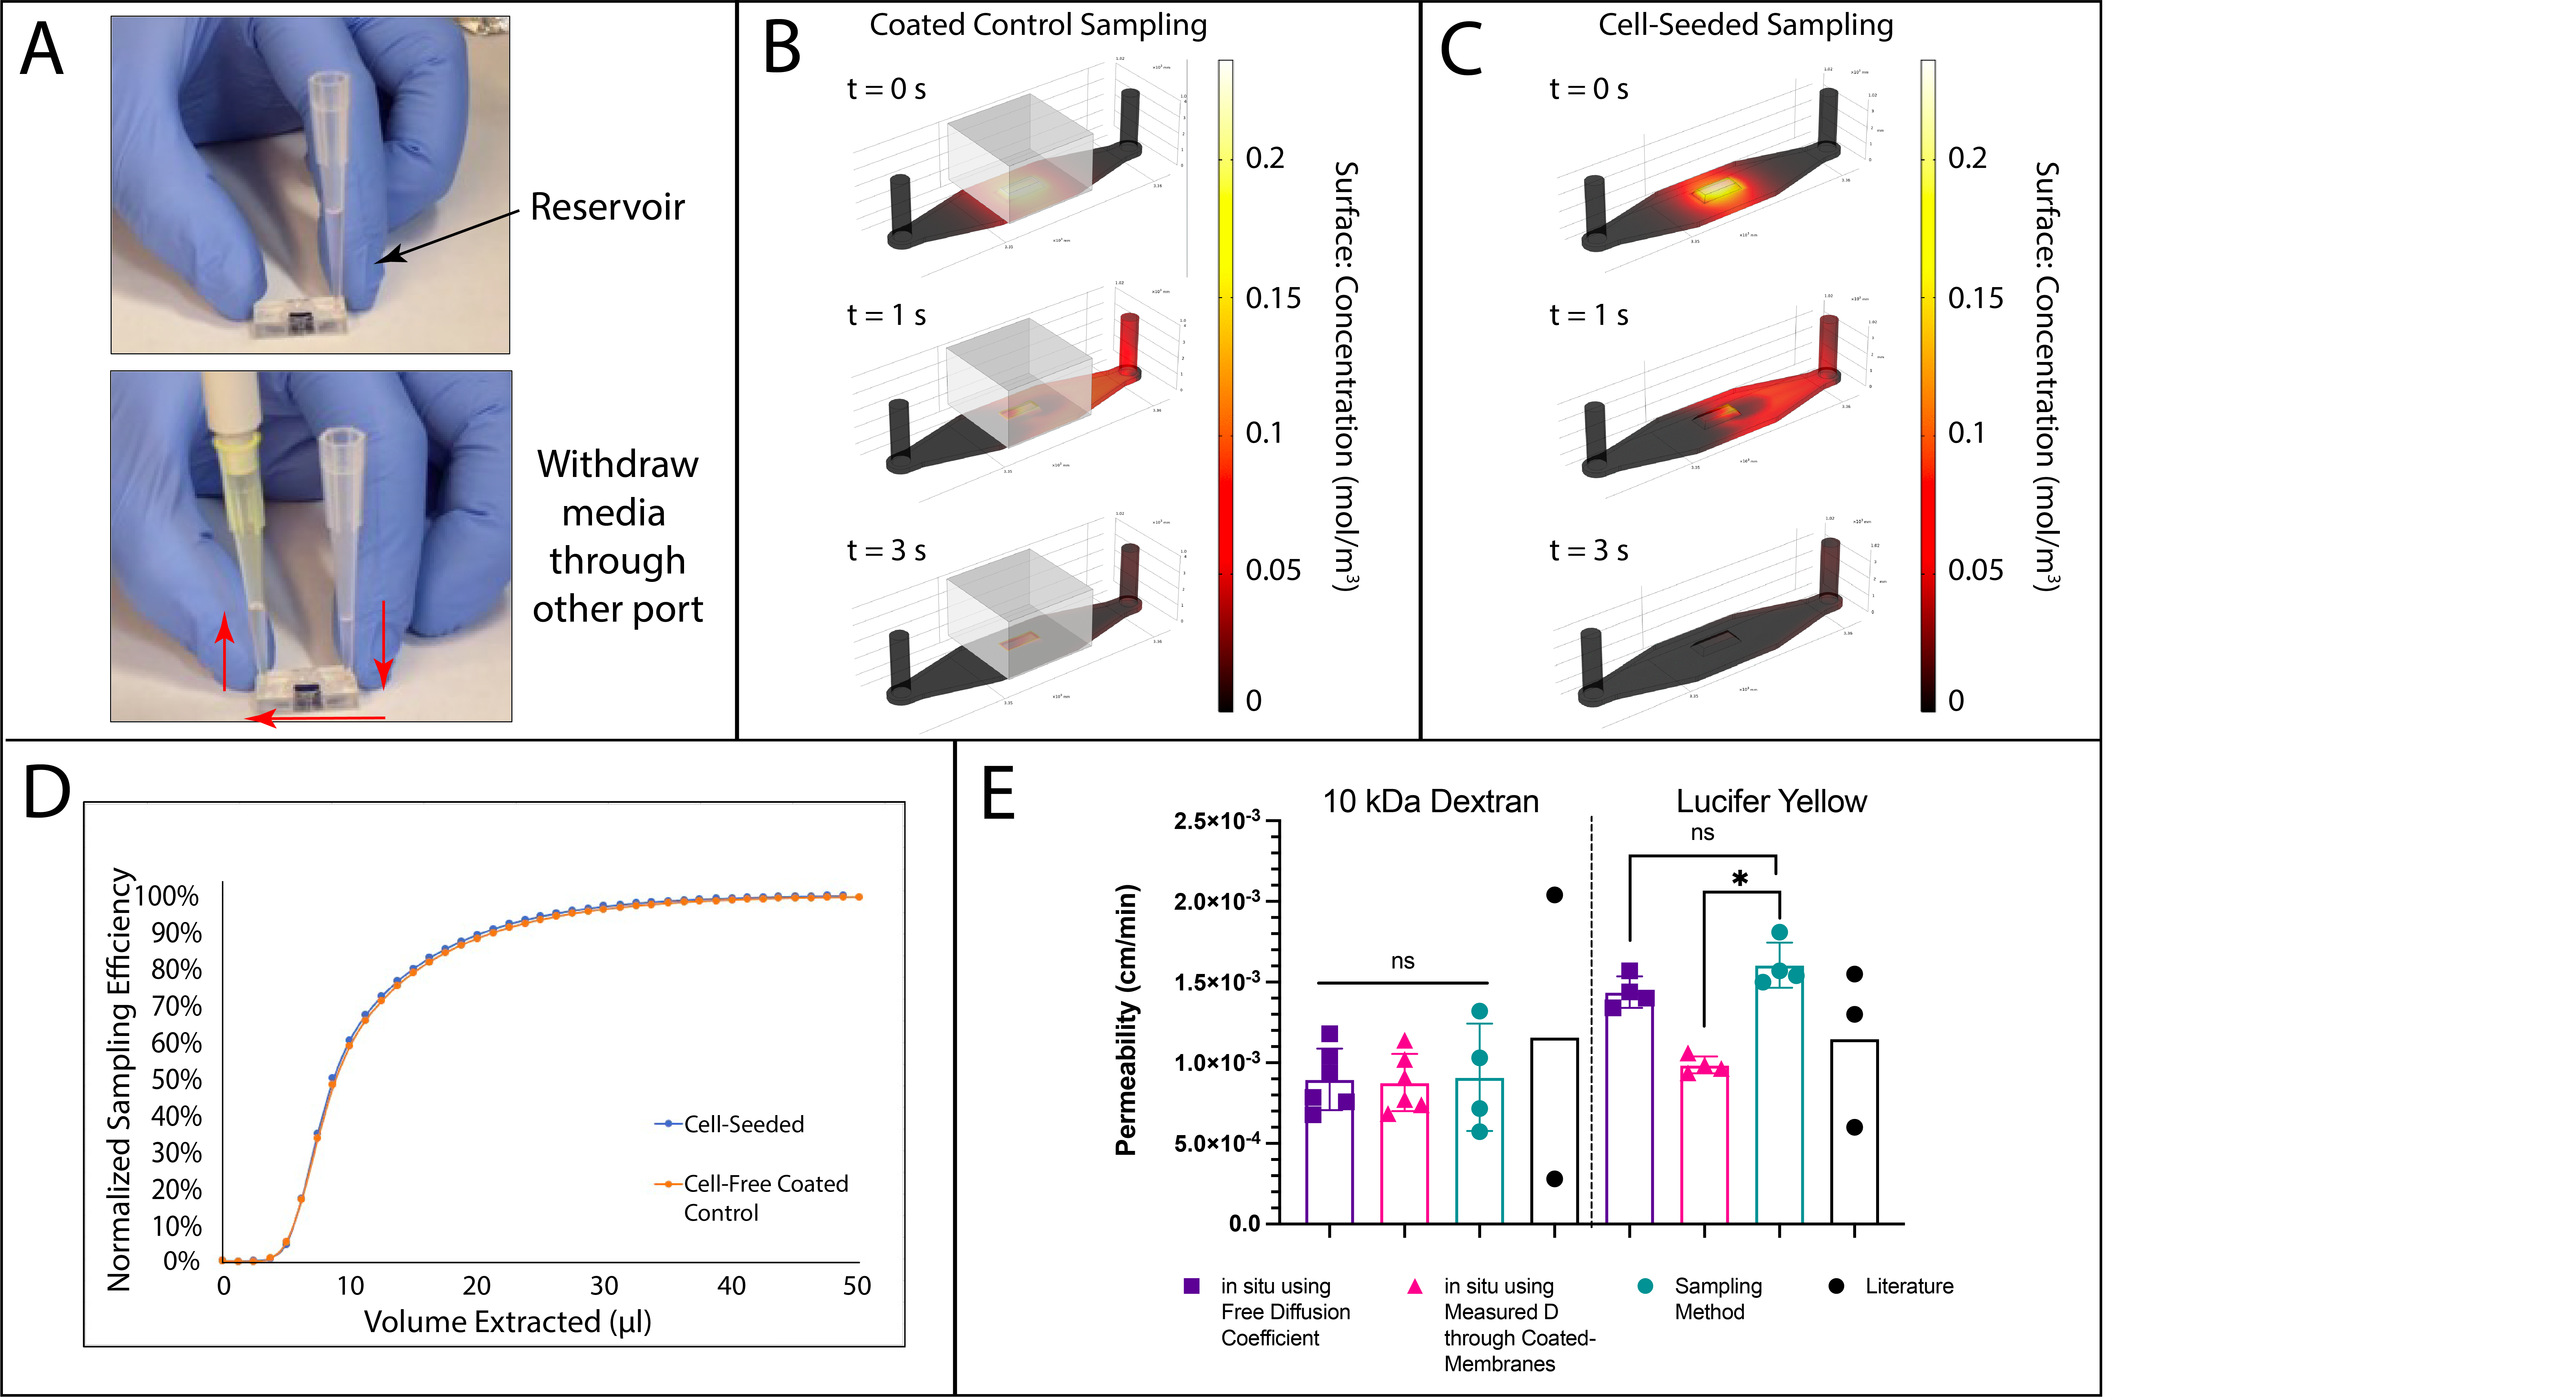
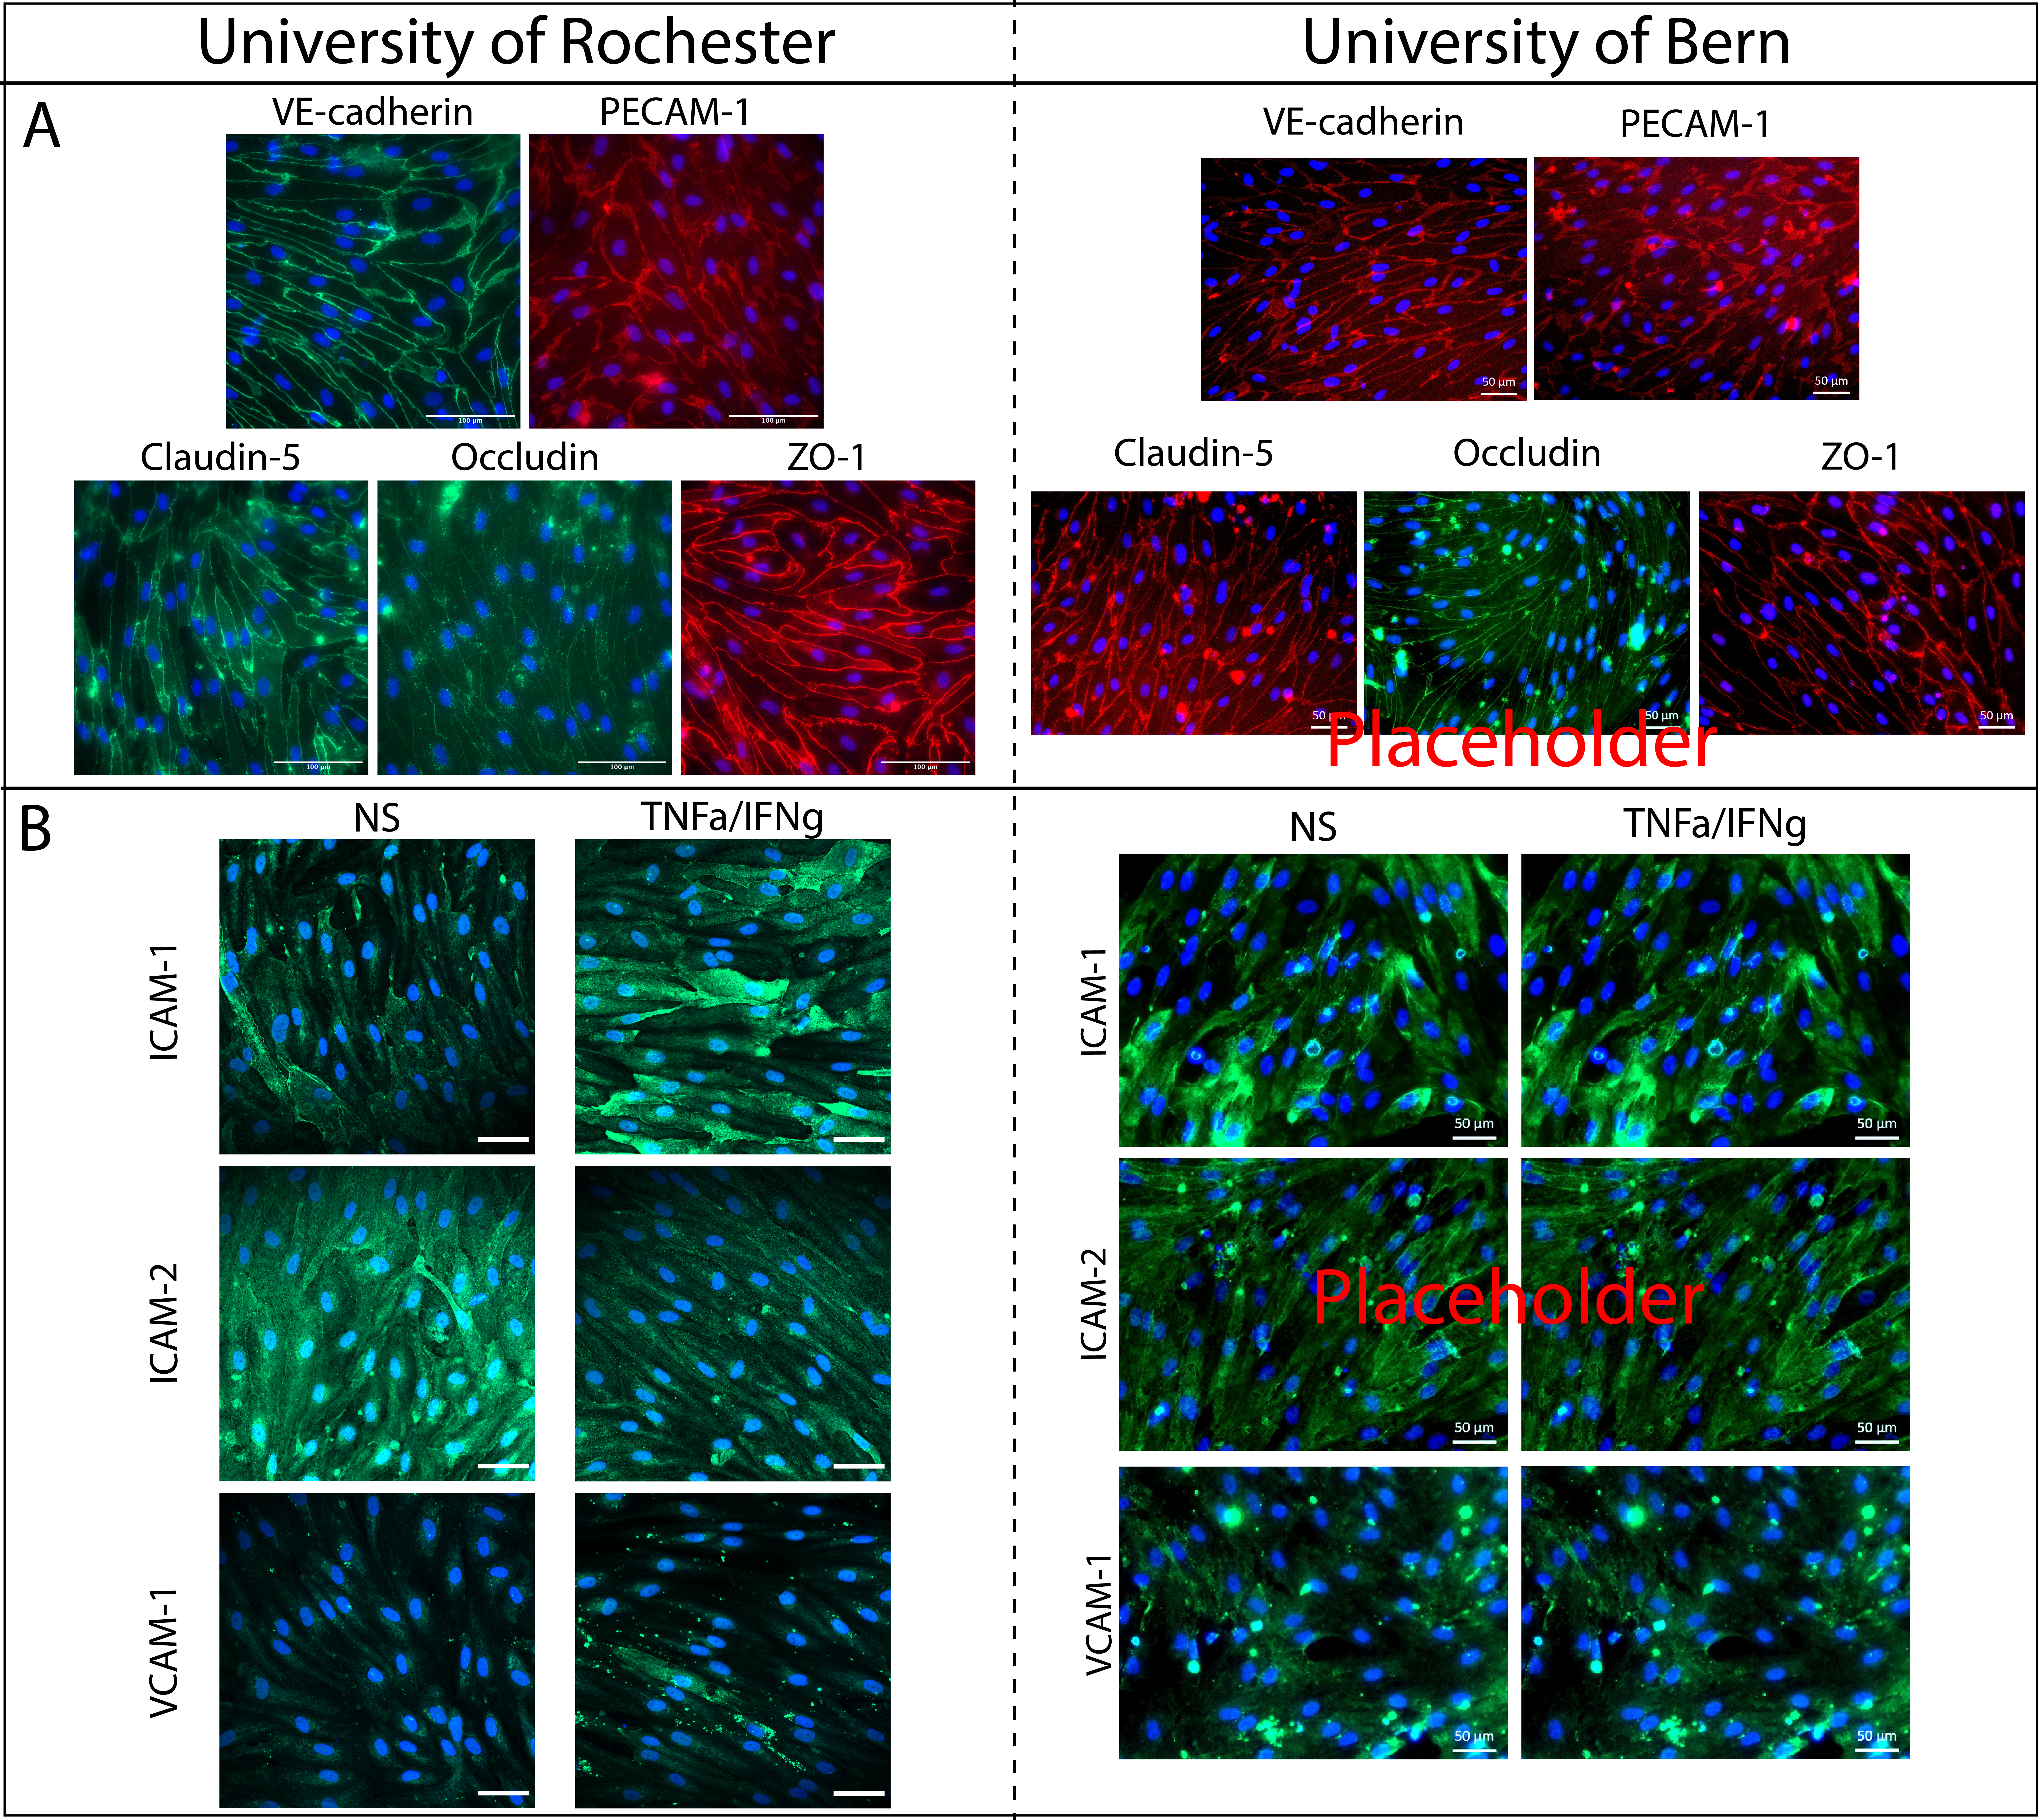
Fig. 1. m-µSiM Assembly. (A) Fixtures are used to guide components and membrane together. Component 1 is composed of an acrylic top layer with a TranswellTM-style open well and a PSA sealing layer. Component 2 is composed of a thin, PSA bottom channel and COP imaging layer. (B) Assembly is a two-step process. Step 1: Bond component 1 and membrane. Place membrane on fixture A1 pedestal. Place component 1 face down over membrane. Use fixture A2 to press firmly and activate PSA. This irreversibly bonds membrane to component 1. Step 2: Bond components 1 and 2. Place component 2 in fixture B1, channel-side up. Place component 1 with membrane onto component 2. Use fixture B2 to press firmly to activate PSA, irreversibly bonding component 1 and component 2. (C) The modular assembly allows different style membranes to readily be selected for the application at hand. Component 1’s open well format allows easy cell culture, and access ports provide access to the bottom channel. They are designed to seal-to-fit standard P20 and P200 pipet tips.Fig. 2. in situ permeability assay optimization on cell-free devices. (A) A confocal microscope is focused 133 µm below the membrane, within the chip’s trench. Dye diffuses from the well into the trench (left). Example of corresponding image (right) highlights region of interest, where 1-D diffusion occurs and fluorescence measurements are taken (yellow line). (B) Diffusion coefficients can be solved using a Fick’s Law-derived equation, modeling 1-D diffusion. This equation assumes there is no widening of trench walls with this model. (C) Dye can be seen diffusing into the trench over the course of ten minutes. Images are of 10 kDa Dextran-AF488 diffusing across a blank NPSN membrane chip. (D) Example plots of diffusion across uncoated and coated chips using 10 kDa Dextran-AF488 (top) and lucifer yellow (LY, bottom). The analytical solutions fit well the the experimental data. The resulting diffusion coefficient from the analytical solutions for 10 kDa Dex-AF488 across an uncoated membrane are in statistical agreement with the literature. Coating the membrane significantly decreases the apparent diffusion coefficient, whereas larger apparent diffusion coefficients are measured with smaller molecules. N = 3 per group. Students t-test, p < 0.05.Fig. 3. in situ permeability assay optimization using hCMEC/D3. (A) A confocal microscope is focused 133 µm below the membrane, within the chip’s trench. Dye diffuses from the well, across an endothelial cell layer, and into the trench (left). (B) Permeability can be solved using a constant flux model. (C) Example plots of the analytical solutions for permeability of 10 kDa Dex-FITC (top) and lucifer yellow (bottom) across an hCMEC/D3 monolayer using the free diffusion coefficient. The analytical solutions fit well the the experimental data.Fig. 4. Sampling permeability assay optimization and validation of assays. (A) Sampling method process for collecting dye from the channel. A reservoir is added to one port that access the channel, and another pipet is used to pull media across. Media withdrawn is added to a well plate for fluorescence measurements. (B) COMSOL was used to model the sampling process across coated-control devices (B) and cell-seeded devices (C). HOWARD BRIEF SENTENCE OF MODEL FOR DIFFUSION. (D) COMSOL model sampling efficiency of lucifer yellow for different volumes extracted from the channel. Sampling using a single 50 µl draw clears dye from the channel for both coated-control and cell-seeded devices. (E) hCMEC/D3 permeability to 10 kDa Dextran and luficer yellow experimentally determined using the in situ and sampling methods. The in situ method includes analysis using both the free diffusion coefficient and measured diffusion coefficient through coated-membranes. Permeability values found in the literature are included. N = 4-6 per group. Two-way ANOVA, p < 0.05.Fig. 5. Validation of m-µSiM distribution to non-engineering labs and replicability of data utilizing EECM-BMEC-like cell differentiation protocol. (A) EECM-BMEC-like cells express similar patterns of key junctional molecules when derived and cultured on m-µSiM devices at UR and UniBe. (B) EECM-BMEC-like cells upregulate expression of cell adhesion molecules upon exposure proinflammatory stimuli in a comparable manner when derived and cultured on m-µSiM devices at UR and UniBe.
Remaining data to obtain: Occludin staining in IMR90-4 from UniBe in µSiM. We have tried this after 2 day culture in µSiM, which worked at UR but is not working at UniBe.
Current problem: Occludin is not seen in junctions but in cytosol.
Solution A: Test longer culture time to give junctions time to mature.
Solution B: Use ReDup or do not show reproducibility for occludin in figure. Note difference in Supplement.
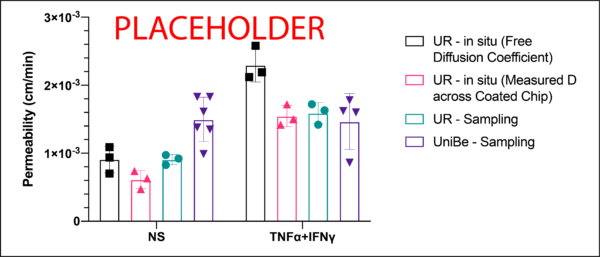
Fig. 6. EECM-BMEC baseline permeability and response to TNFa+IFNg treatment. EECM-BMEC-like cells demonstrate comparable baseline permeabilities between lab. Cells increase permeability in response to proinflammatory stimuli in a comparable manner when derived and cultured on m-µSiM devices at UR and UniBe.
Remaining data to obtain: Sampling permeability data of IMR90-4 from UniBe in µSiM. We have tried this after 2 day culture in µSiM, which worked at UR but is giving high baseline permeability at UniBe.
Current problem: Baseline permeability is too high at UniBe in µSiM and no response to cytokines. Same cells in transwells are fine.
Solution A: Test longer culture time to give junctions time to mature. Hopefully this will improve baseline permeability and we will now see response to cytokines.
Solution B: Use ReDup or HUVEC to show success of permeability assay in a non-engineering lab.
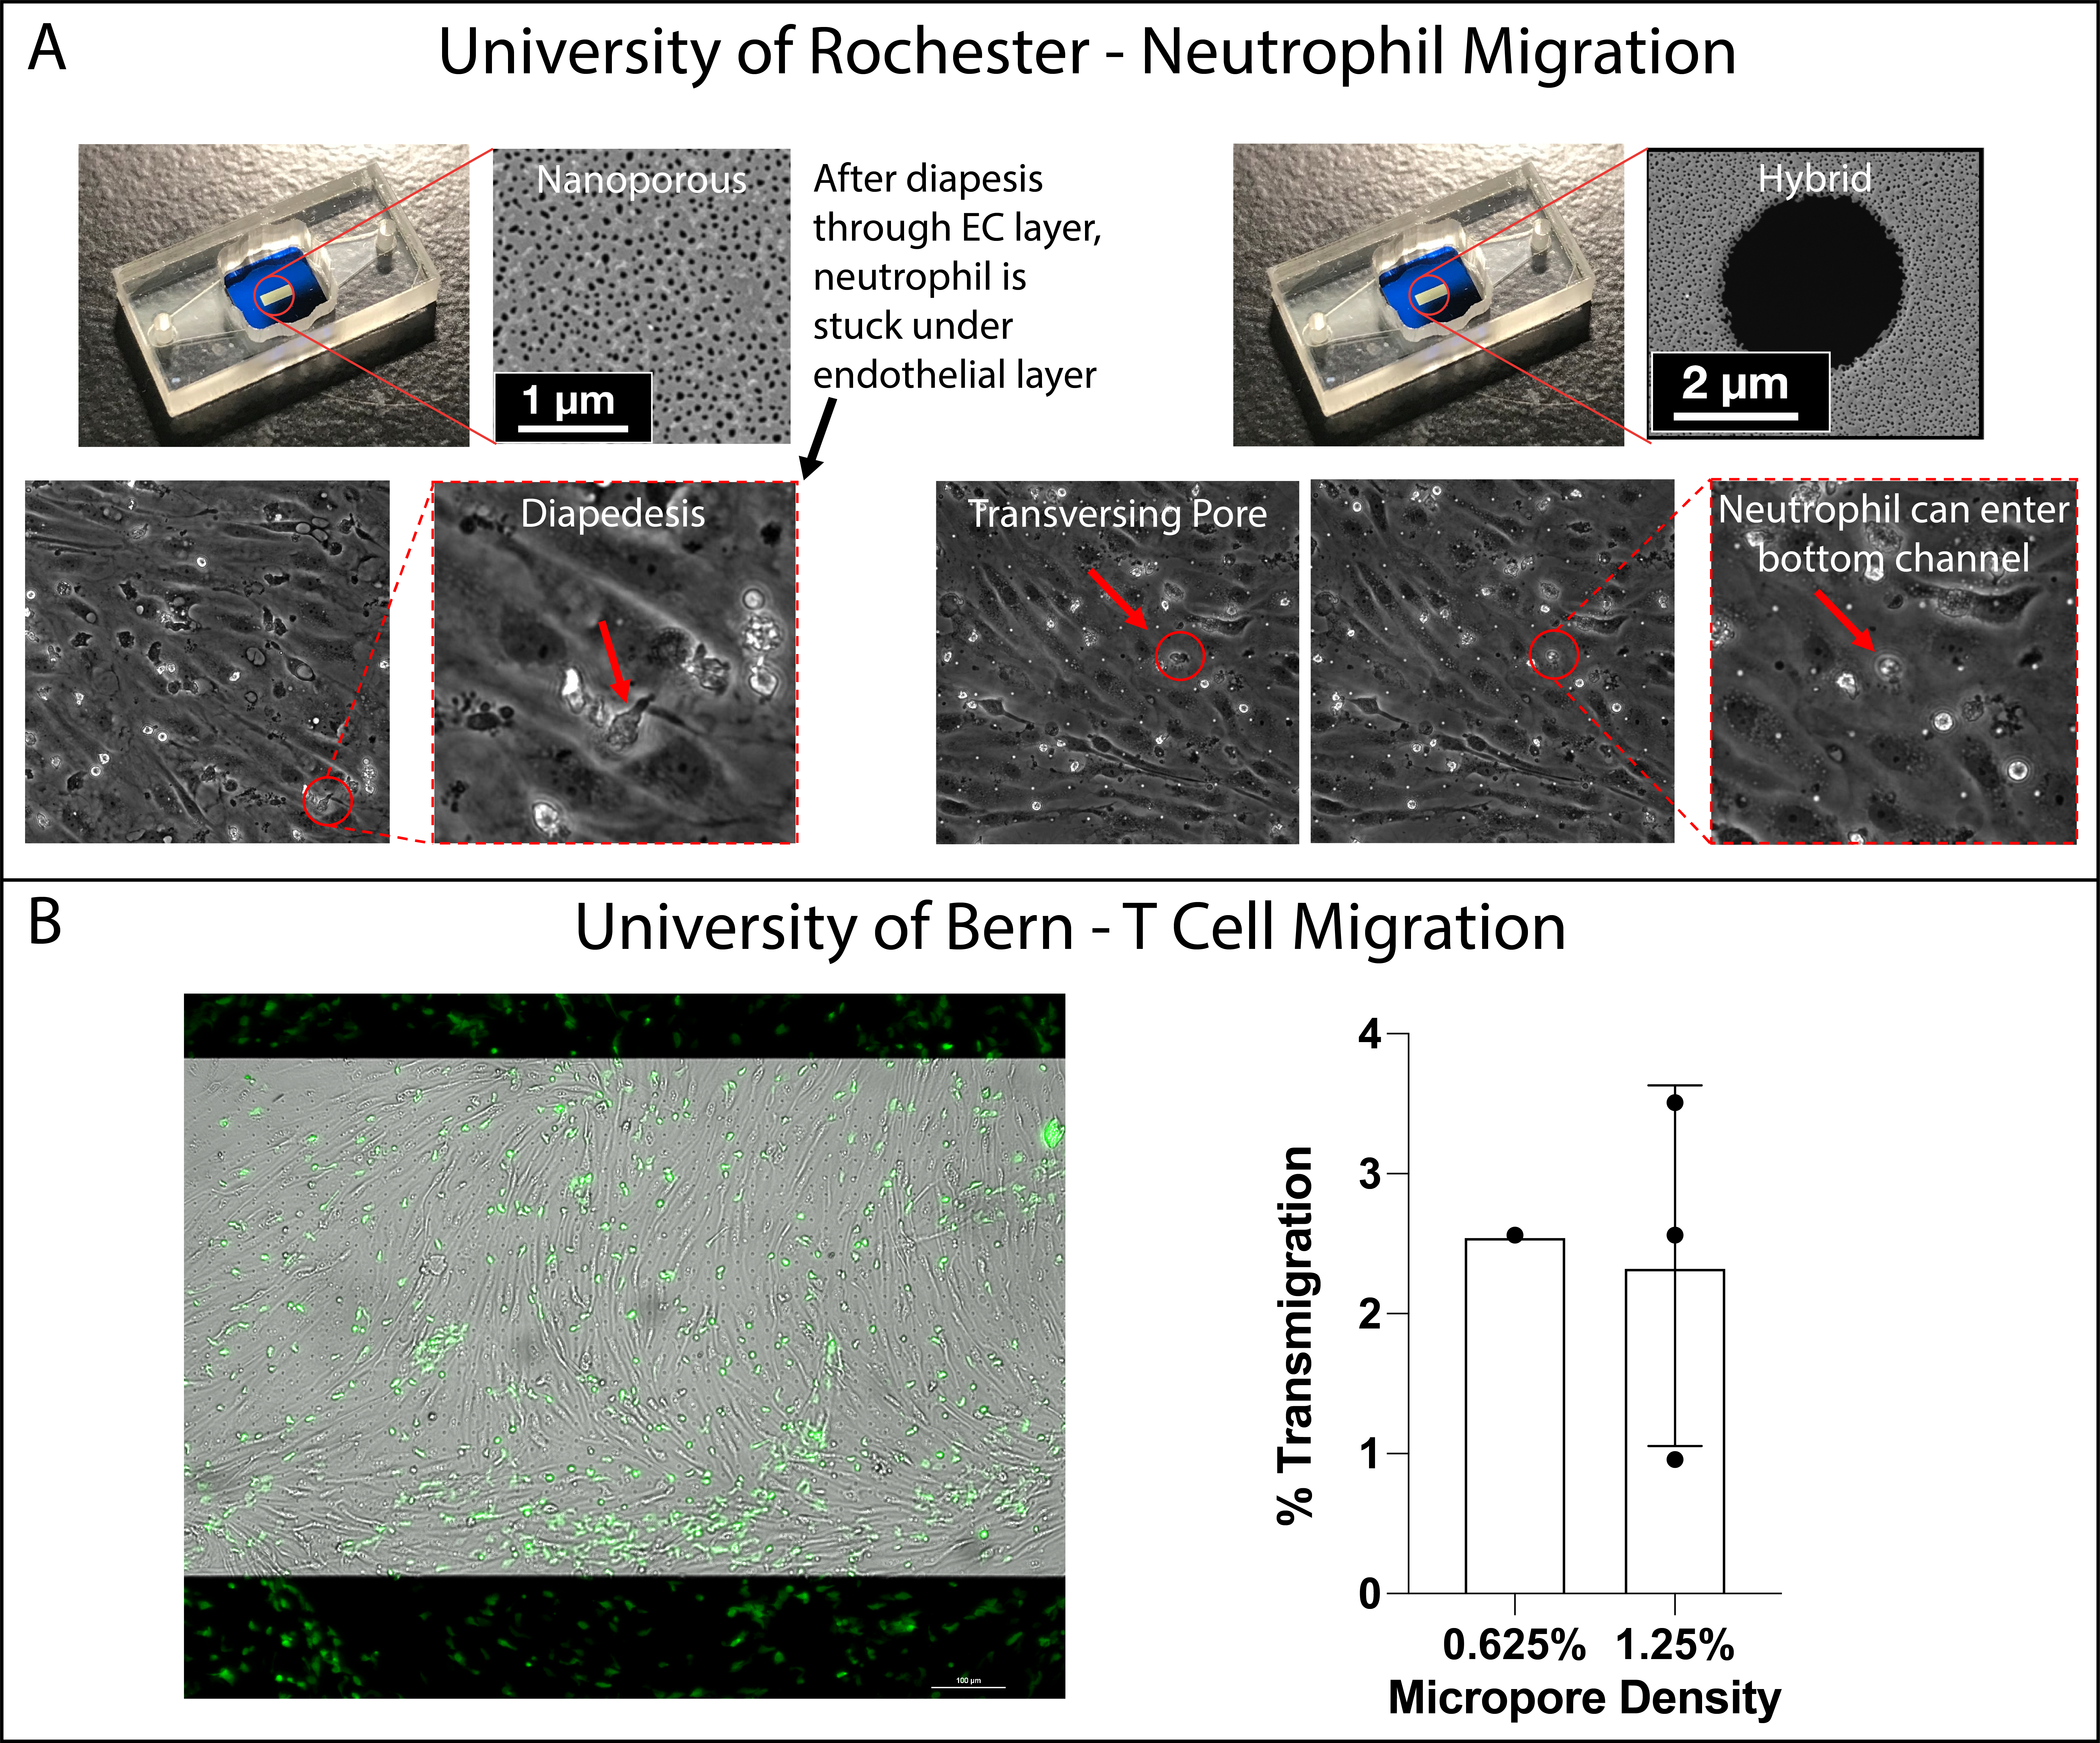
Fig. 7. Modularity of m-µSiM is demonstrated in immune cell transmigration studies. (A) Neutrophil migration across EECM-BMEC-like cells. While migration using both NPN and hybrid membranes can be analyzed by video tracking, only neutrophils migrating across hybrid membranes can enter the bottom channel and be collected for further analysis. (B) Statement about Bern T cell migration.
At UR, we need to repeat with Dan’s optimized methods. The EECM-BMECs recede in videos for NPN.
At UniBe, we see about 3% migration of T cells into channel after 2 hrs on non-stimulated EECM-BMECs. Transwells usually have about 10% migration but higher micropore densities. We have several example images of remaining adhered T cells. We would need to repeat 0.625% micropore density if we want to include both since two chips broke in preliminary experiment. We could also cut 0.625% and just show we see nothing across NPSN.
We’ve been assuming that porosity follows a linear relationship with respect to wafer position, but this turns out to be incorrect. I imaged membranes from five points on wafer 620 and found that maximum porosity does not occur at the outer most sample, as previously thought, but instead at r=3. Does this provide a better…
I ran a few tests with rhodamine to see if the fluorescence will transfer across the cell. The problem I keep having is that the stir cell set-up is very sensitive. If the wing nuts are tightened too much the membrane will break. But if they are too loose the liquids will leak out. Luckily…
A simple experiment that has never been done is to make a direct comparison between annealing inside and outside the susceptor. Intuitively, we would expect the morphologies to be quite different since the heating mechanism is different for both cases. Inside the susceptor, the film is heated through blackbody radiation from the susceptor. Without the…
My previous post on Electroomosis theory describes the deviation between expected and calculated zeta potential using the Smoluchowski equation. In this post I will explain another method of solving for the zeta potential and I will consider the mistakes made in the previous calculations. In a paper by Kim(Mukhtar) in J. Membrane Sci. (1996), the…
One of the issues with my microporous MgF2 cell culture experiments is the apparent multilayer of cells that form on the freestanding area; ideally we would have a nice cell monolayer for imaging. It has been unclear if this was an effect of overseeding or if cells were migrating to the freestanding area. To this…
The permeability data is very different for films deposited at room temeperature and 400C.The 400C deposited wafers have much higher permeability and more consistent. w335 – RT w336-RT w338 -400C w340 – 400C Burst Pressures