A Modular vascular barrier platform with a removable flow module and high resolution imaging (Publication draft)
1. Introduction
1.1 Vascular barriers
Functions: Maintain tissue homeostasis, control transport and gas exchange, recruit immune cells during inflammation

Figure 1. Schematic illustration of a vasculature barrier in the human body. Endothelial cells as a building element of vasculature barriers line up along the vessel walls and separate the vessel from the tissue. Different stages of neutrophil transmigration across the barrier as a physiological process in response to inflammation are shown.
1.2. In vitro platforms for mimicking vascular barriers
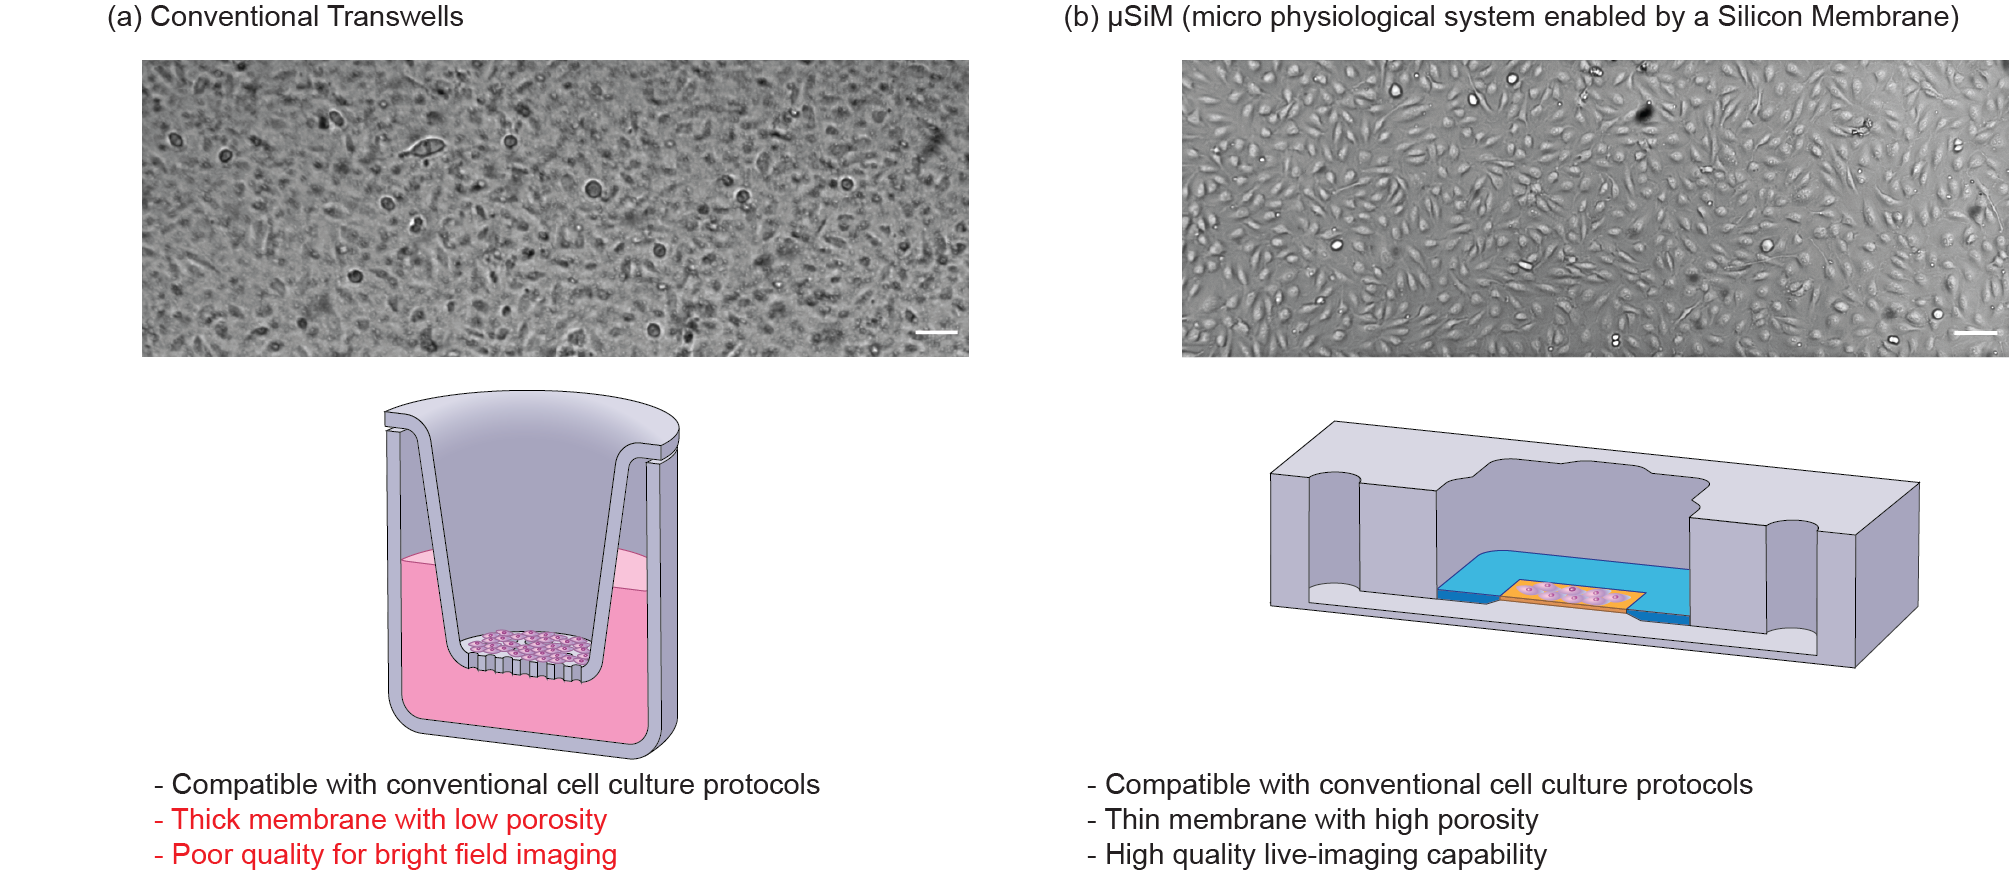
Figure 2. Comparison of conventional Transwells with open-well μSiM and their corresponding imaging quality. µSiM provides an open-well format cell seeding like Tranwells while addressing their imaging issues by using a glass-like ultrathin nanomembrane that enables high-quality imaging. Scale bars are 100 µm.
2. Materials and Methods
2.1 Open-well µSiM device:
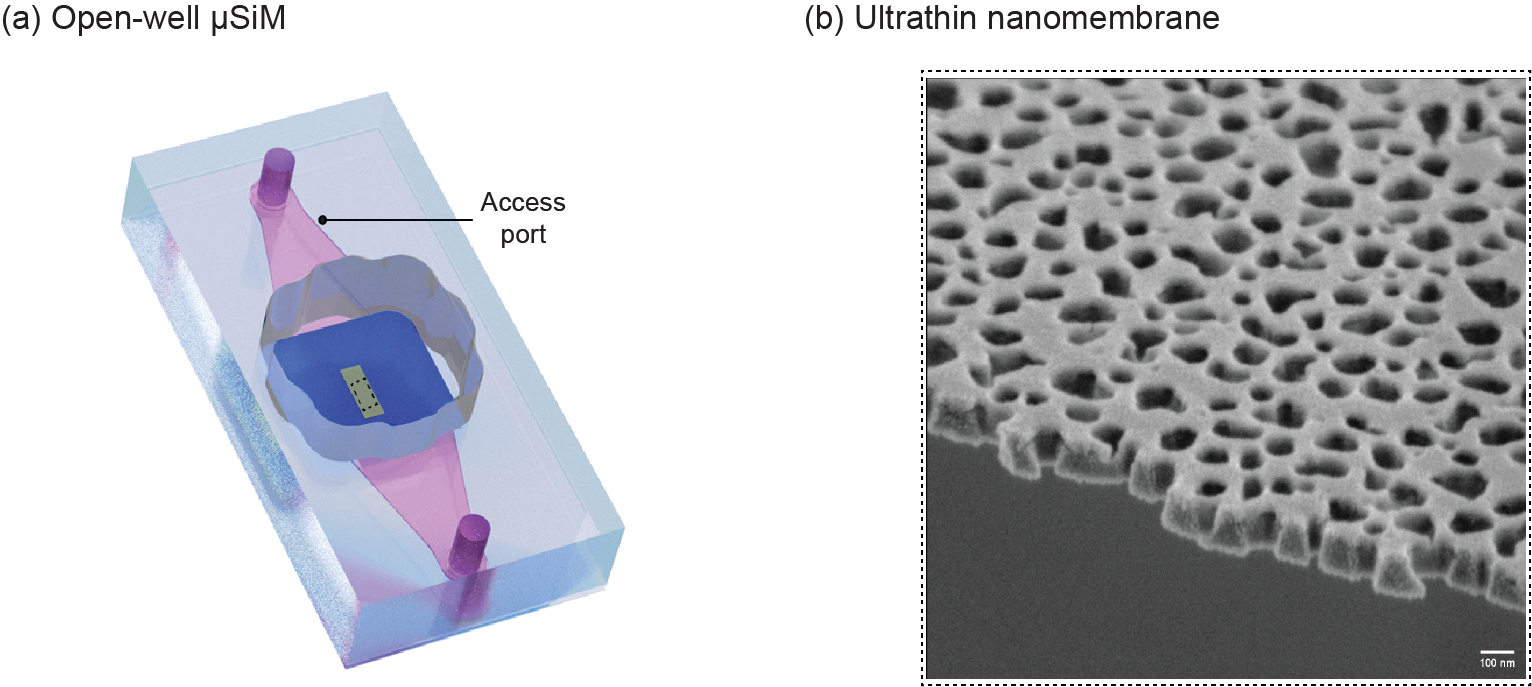
Figure 3. (a) Schematic illustration of μSiM device which consists of an acrylic well and microchannel separated by an ultrathin nanomembrane. Both sides of the membrane can be used for culturing different types of cells (The pink domain represents fluid in the bottom channel, the yellow surface represents nanomembrane, and the blue surface represents silicon support of nanomembrane), (b) SEM image of the NPN nanomembrane with 20 % porosity and pore sizes of 60 nm and thickness of 100 nm.
2.2 Fluidic µSiM:
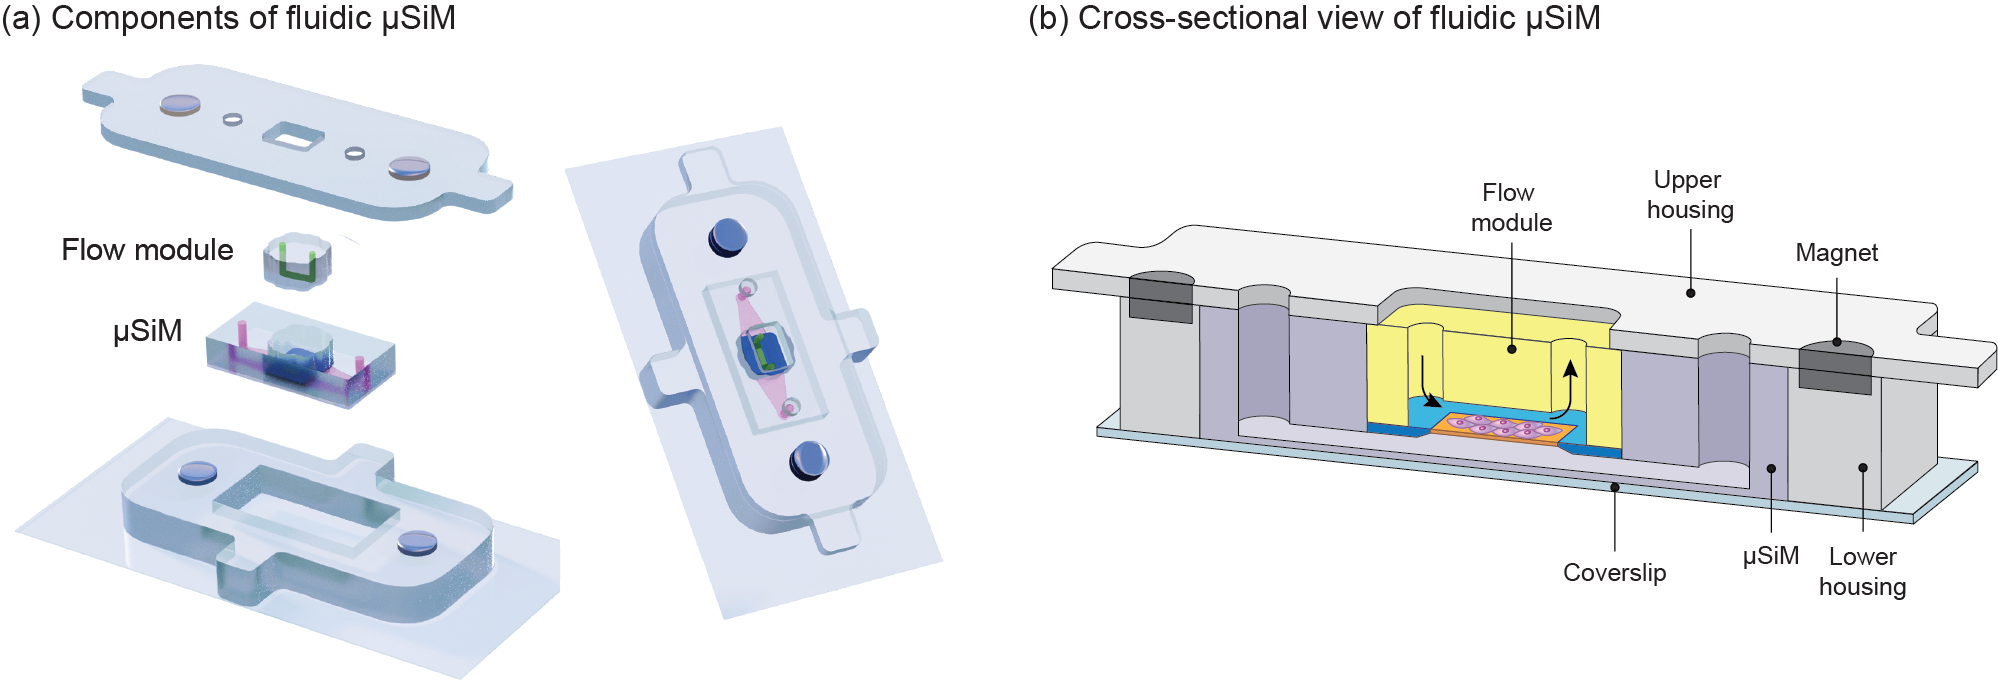
Figure 4. Schematic illustration of the fluidic µSiM platform. (a) This modular design consists of four main components in which a lower housing encompasses the μSiM and an upper housing seals a flow module on the μSiM based on magnetic latching (The green domain represents the fluid path above membrane while the pink domain represents the fluid in the bottom channel), (b) cross-sectional view of the assembled fluidic µSiM (arrows show fluid flow path within the flow module).
2.3 Device assembly: (Video S1)
2.4 Flow circuit:
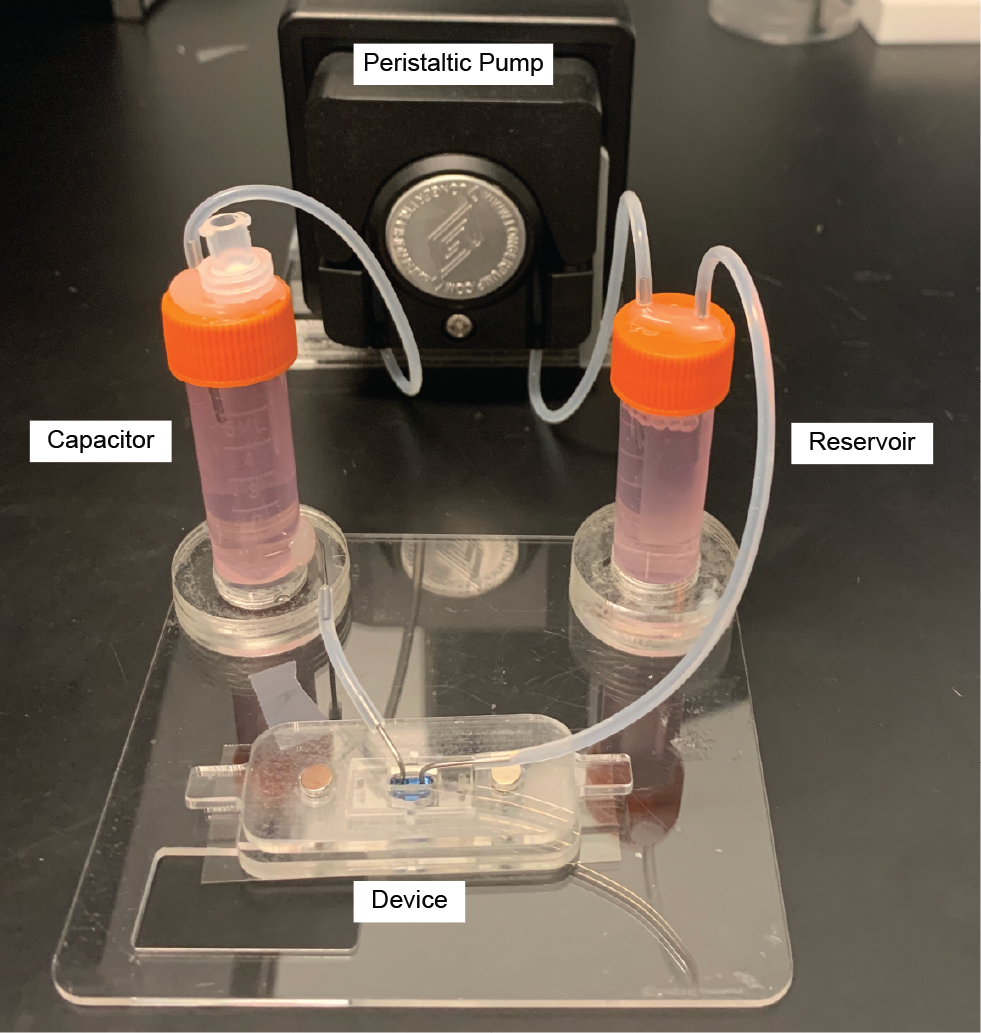
Figure S1. Custom-made flow circuit for flow experiments. The setup includes a peristaltic pump for media circulation throughout the system. The vial with a PVDF filter acts as a capacitor while the other one acts as a reservoir.
3. Results
3.1 Controlled cell patterning
Controlled cell seeding is important for establishing a vascular barrier (Ref: SEAM paper). Also, one of the issues for converting an open-well format platform into a fluidic system is cell squashing upon conversion. Hence, it is important to control cell positioning to prevent cell damage. We developed a removable stencil to address those concerns.
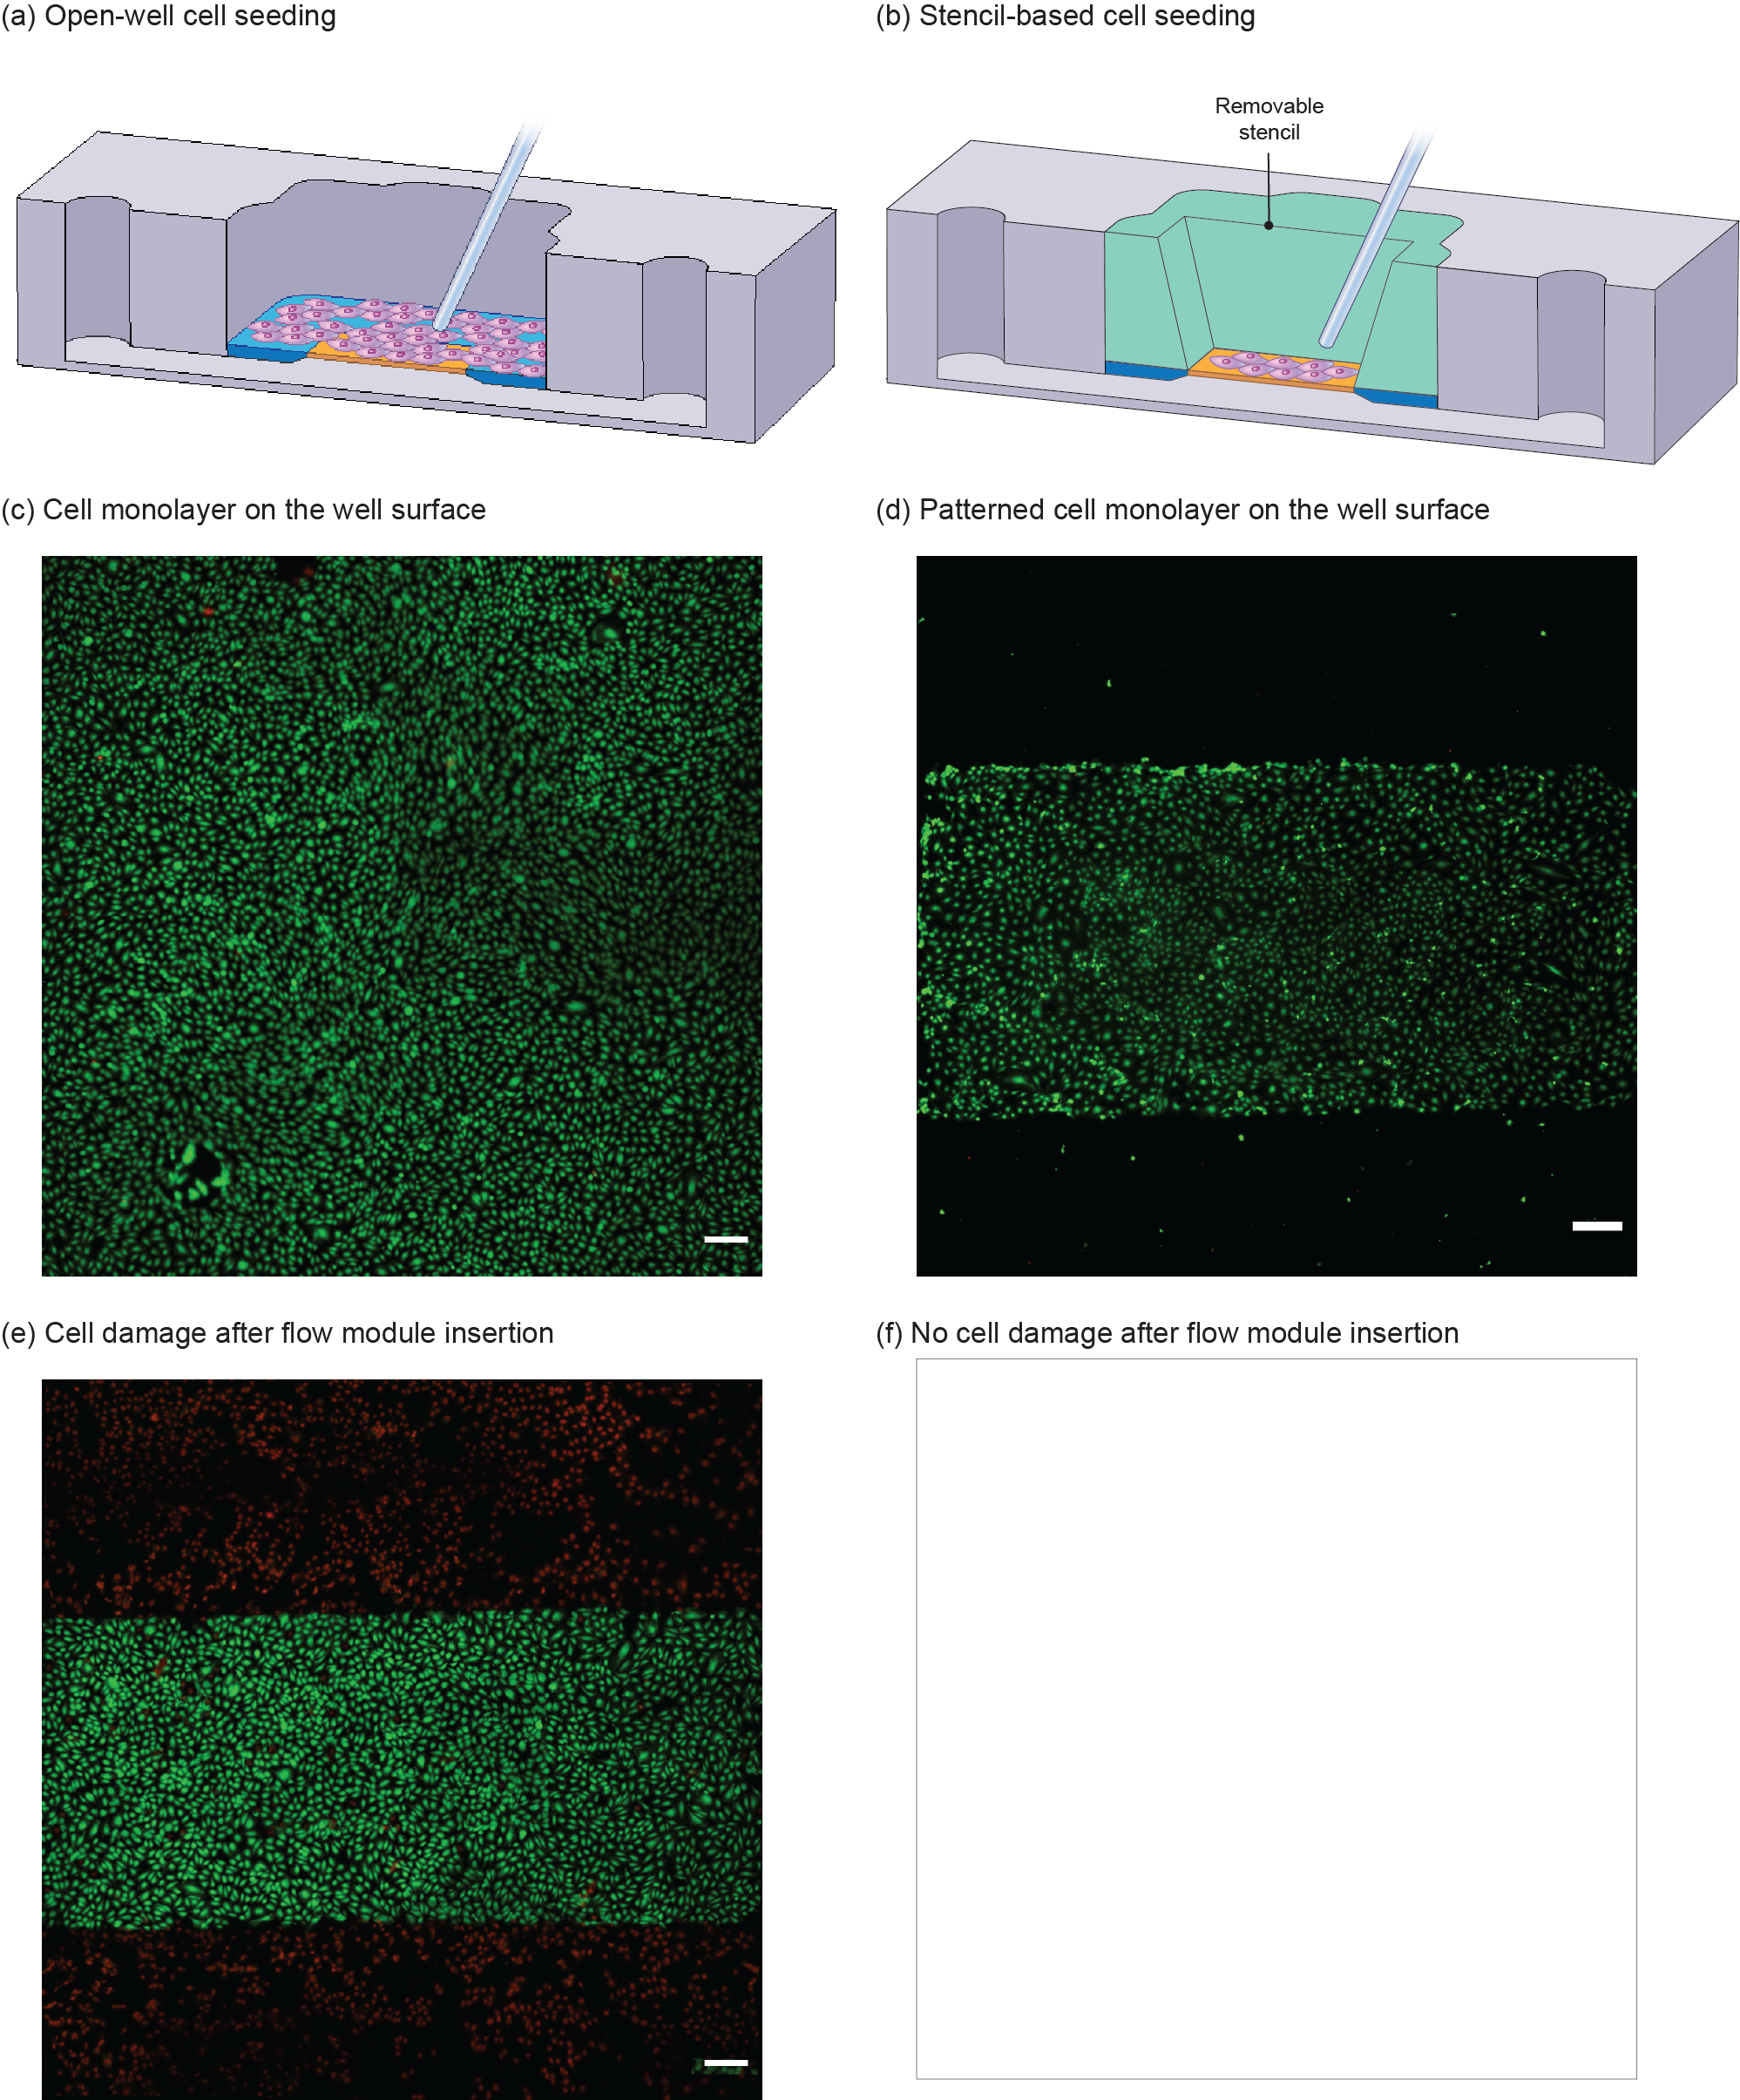
Figure 5. Comparison of (a) open-well format and (b) stencil-based cell seeding. (c) Open-well format cell seeding results in cell settlement all over the well surface and consequent establishment of a monolayer on the membrane as well as its surrounding silicon chip, whereas (d) in stencil-based seeding, cells are positioned selectively; hence, the monolayer only forms on the membrane surface, (e) significant damage of cells on membrane’s surroundings upon inserting the flow module, (f) no cell damage upon inserting the flow module. Scale bars are 200 µm.
3.2. Workflow of the platform
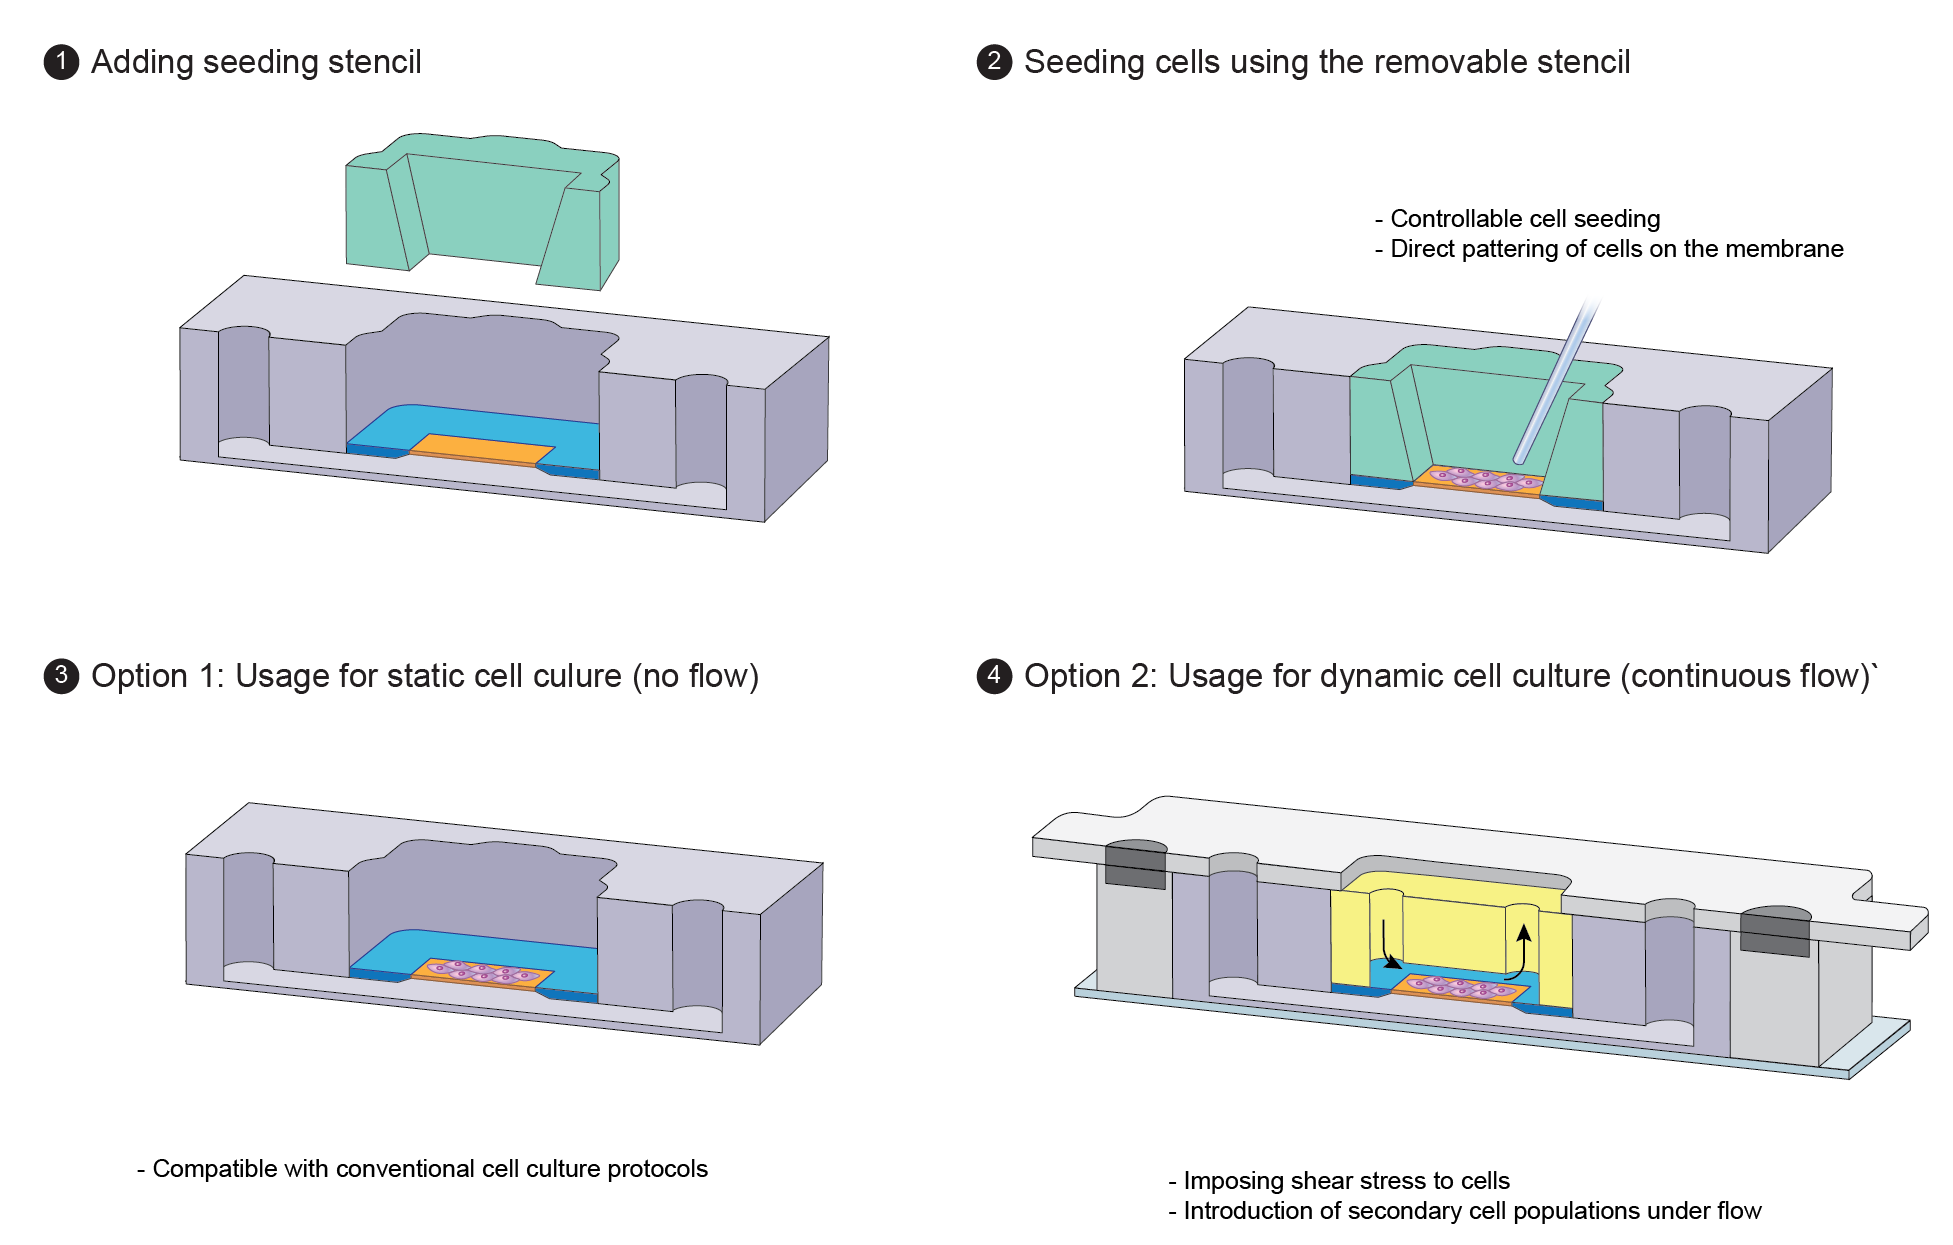
Figure 6. Cross-sectional view of the workflow for the static and dynamic culture of cells in the modular µSiM. (a) Addition of the removable stencil, (b) direct patterning of cells on the membrane, (c) upon barrier establishment, the stencil can be removed and the open-well µSiM can be used as a static platform, (d) for dynamic culture usage, the flow module can be inserted and sealed within µSiM using housings based on magnetic latching. After dynamic cell culture, the housings and flow module can be removed to reconvert the system into open-well µSiM and have direct access to the barrier for post experiments.
3.3 Experimental validation of the fluid flow simulation
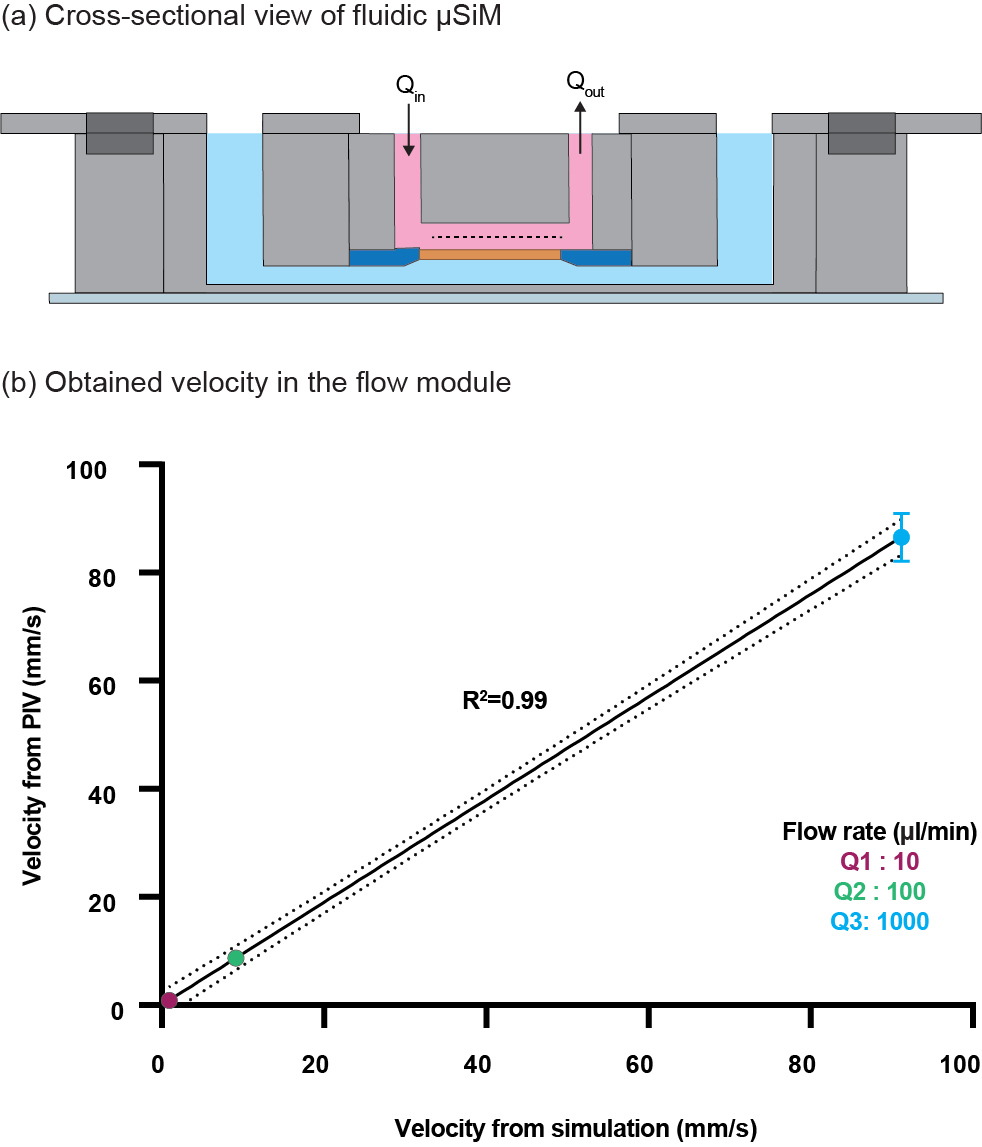
Figure 7. Experimental validation of the simulation using the PIV technique. (a) Schematic of the device and flow domain within it; Velocities from PIV and simulation are obtained from the middle plane of the microchannel at z=h/2 (dashed line), (b) Measured velocities from PIV and simulation at different flow rates. Error bars represent the standard deviation and dotted lines of the graph represent 95% confidence interval (n=3).
3.4 Shear-induced alignment of Endothelial Cells
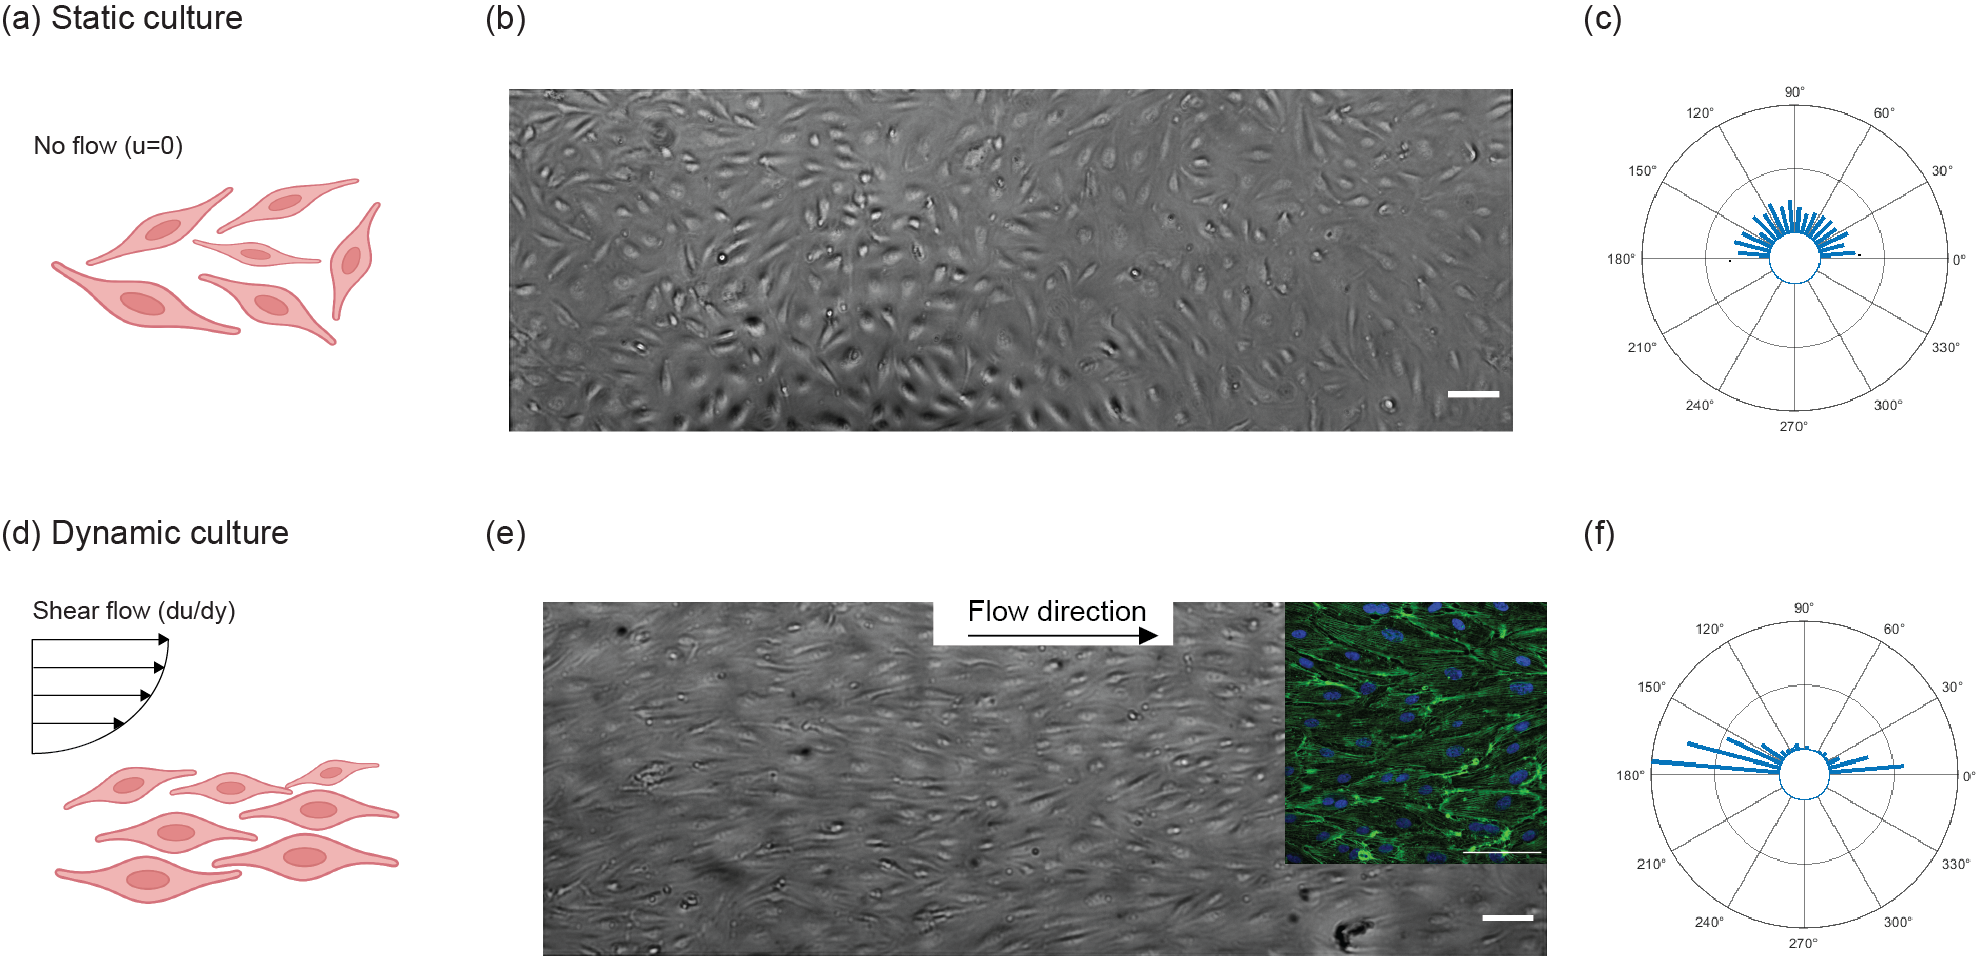
Figure 8. Comparison of the ECs cultured under static and dynamic conditions. (a-c) In the static culture, cells were cultured for 48 hours without flow in which they showed no alignment. (d-f) In the dynamic culture, cells after 24 hours of static culture, were exposed to 10.7 dynes.cm-2 shear for 24 hours showed alignment along the flow direction (the inset shows actin and nuclei of aligned cells in green and blue respectively). The radius of the circles in the radar plot represents the number of cells (inner circle: 0, middle circle: 50, outer circle: 100). Scale bars are 100 µm.
3.5. Neutrophil Transmigration study
Neutrophil transmigration: (Figure 9 and Video S2): Due to the excellent imaging and fluid flow capability of our platform, we are able to demonstrate neutrophil transmigration live.
![]()
Figure 9. Schematic and live demonstration of Polymorphonuclear neutrophil (PMN) transmigration across an endothelial monolayer under continuous flow (10 μl.min-1). HUVECs were cultured in an open-well format; then, the platform was converted into a fluidic system for the neutrophil introduction. As neutrophils traverse the endothelial monolayer, their phase view changes from bright (luminal side) to dark (abluminal side). Scale bars are 20 µm.
Neutrophil activation: In order to evaluate the potential of our fluidic system for neutrophil activation, we performed fluid flow analysis and found out where maximum shear stress occurs in our device (Figure. 10). Based on our analysis, we found out that the maximum shear stress within our device is below 1 dyne/cm2 at a flow rate of 10 μl/min which is below the activation threshold of 1.5 dynes/cm2.
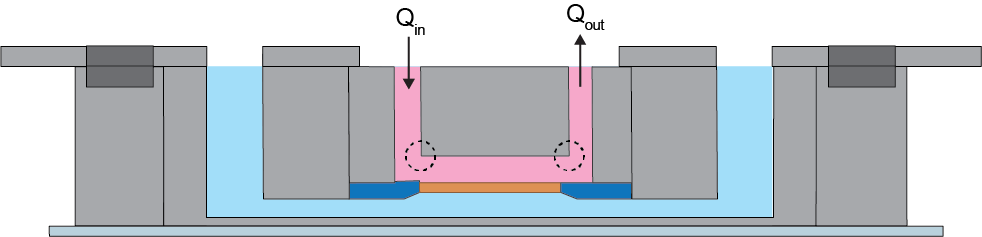
Figure 10. Cross-sectional schematic illustration of the fluidic µSiM. Dashed circles represent where the maximum shear stress occurs within the device.
To experimentally confirm that the fluidic µSiM does not affect neutrophil activation, we introduced neutrophils to the system and performed flow cytometry (Figure 11). Our quantitative results show that the post isolation stock (negative control) and the flow module have 5.5% and 14 % activation, respectively, while the positive control has more than 51% of neutrophil activation.
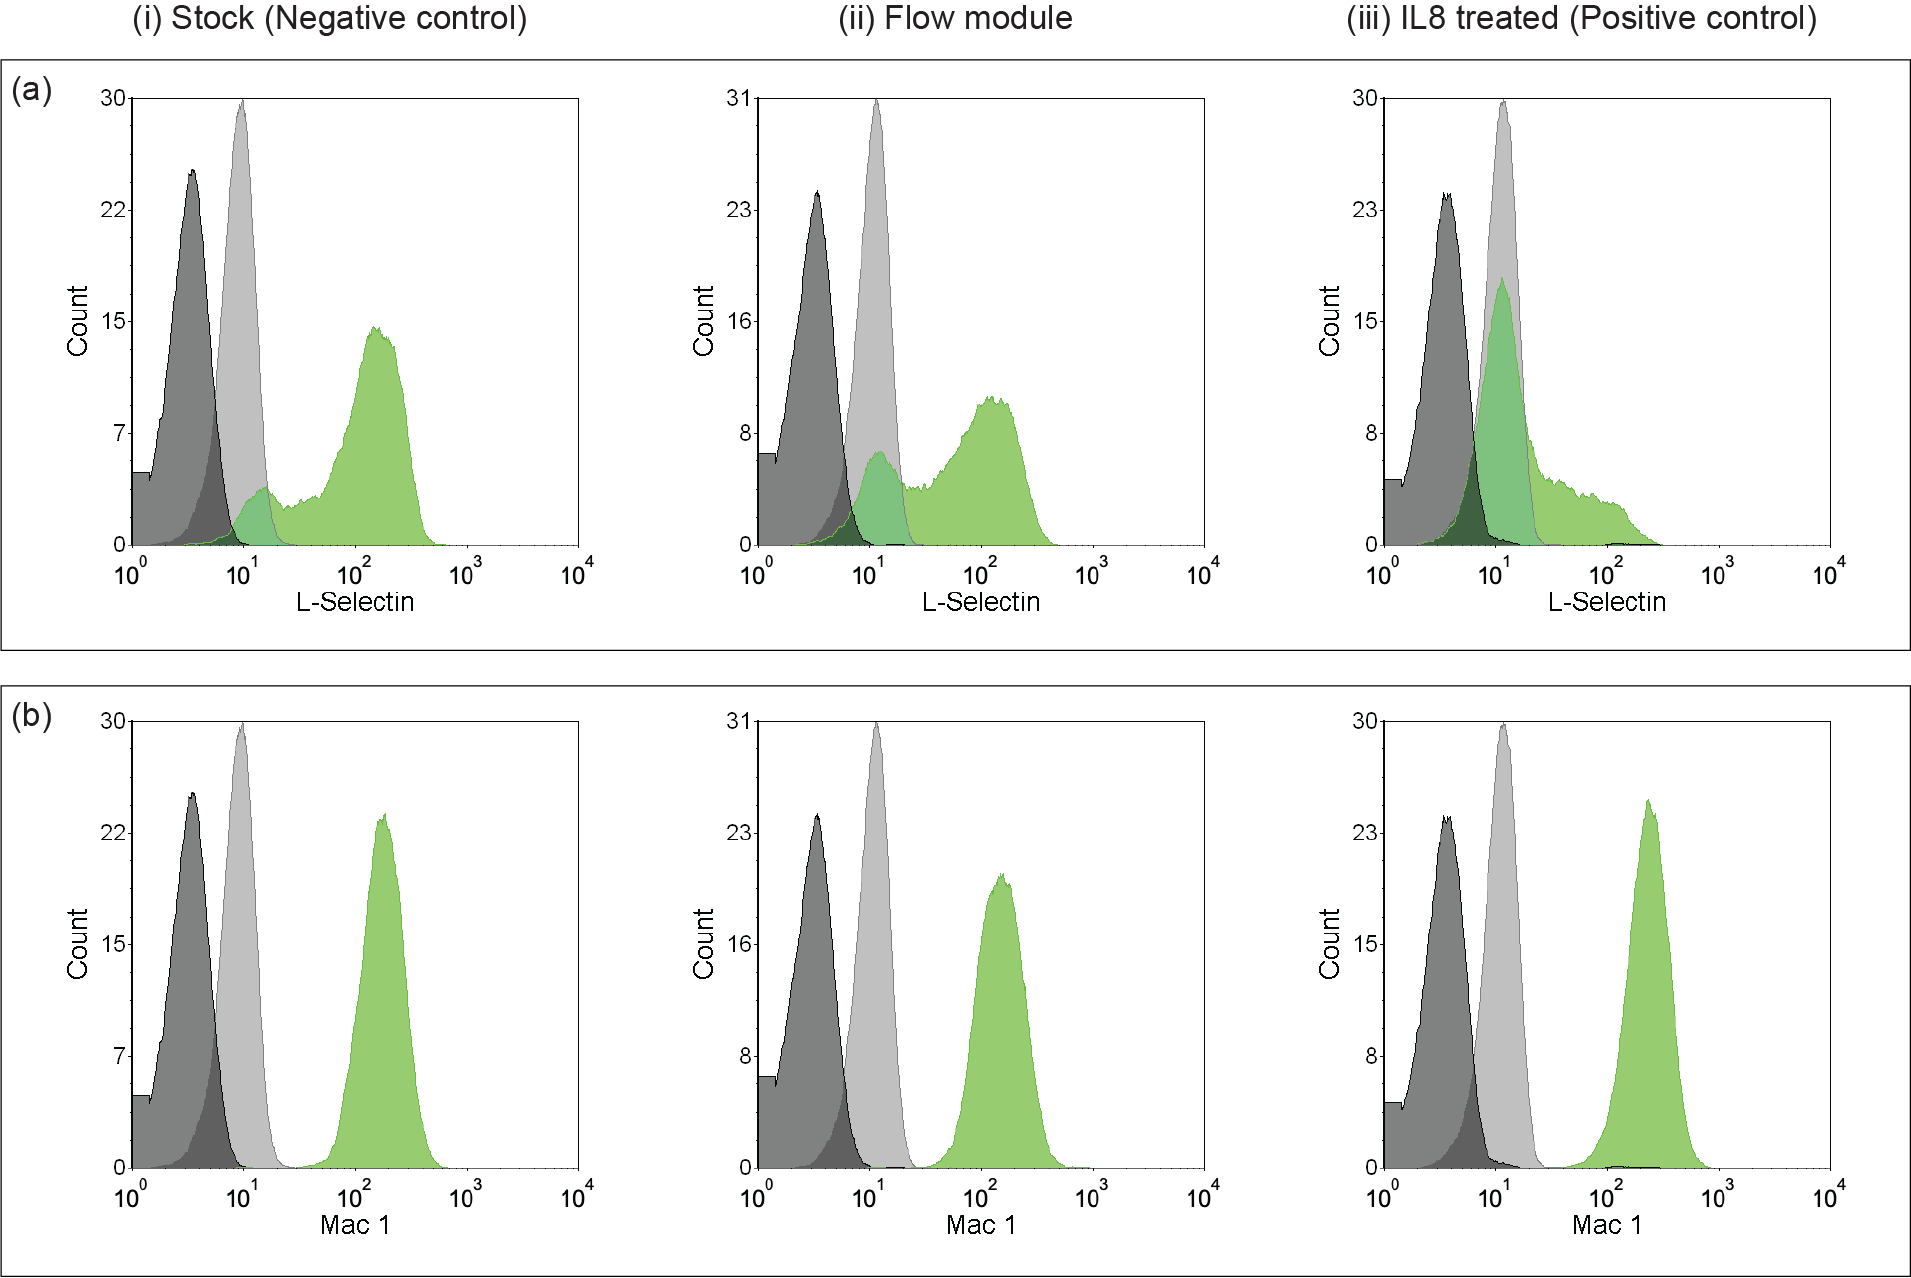
Figure 11. Flow cytometry analysis of neutrophil activation using (a) L-selectin and (b) Mac-1 as biomarkers. (i) Post isolation stock represents the negative control, (ii) neutrophils pulled through the flow module showing a similar trend to the negative control, whereas (iii) IL8 treated neutrophils as the positive control show loss of L-selectin and Mac-1 upregulation because of activation.