Similar Posts
Optimizing Urea Clearance via Flow Rate
In my previous post, our urea clearance for the single pass experiments was found to be ~140 ml/min/m^2, which was similar to Fissell/Roy’s value except we used a flow rate of 1uL/min whereas they used a flow rate of 10 ml/min however. To show that we could achieve even greater clearance values than their group…
The onset of pore formation in NSN and OSO stacks
ByJoe QiA few weeks ago, I did some RTP annealing of NSN and OSO stacks. The purpose of this annealing experiment was hoping to capture the onset of pore formation and see whether there is any different behavior between NSN and OSO stacks. The annealing temperature was set to 700C. The ramp rate was 50C/s all…
Polycarbonate Sheet — substrate material
ByJimI worked with Paul this afternoon and finally we highly suspect the raw material used for the prototype diffusion chamber could be Polycarbonate. Paul could not provide direct evidence for the material source since he did not keep any purchase orders or materials data sheet… However, we did check our chamber with another plastic board…
Fluorescence Adsorption Assays
Glass chips and pnc-Si membranes were incubated in 1mg/mL FITC labeled BSA for 30min. They were vigorously washed in a large beaker of PBS. Chips were placed on a slide and imaged with fluorescence scope. For this study, it seems that the fluid surrounding the chip was much brighter than the chip itself. The following…
From nanosphere self-assembly to free-standing membranes
We are working on finishing up a manuscript on our nanosphere lithography work. this post shows some of the figures for said publication. This paper includes work done with 300 and 200 nm NS as preliminary work, and then focuses on 200 nm NS only to evaluate the porous pattern obtained. From the data presented,…
SepCon Permeability Tests
This is some really preliminary data that I hope to add to in the next couple of days. Yesterday I prepared 4 SepCon samples from wafer 310. I spun them at 3.3 psi for 2 hours with just PBS. I recorded the permeability, and then performed the exact same test with 3mg/mL protein in the…
2 Comments
Comments are closed.

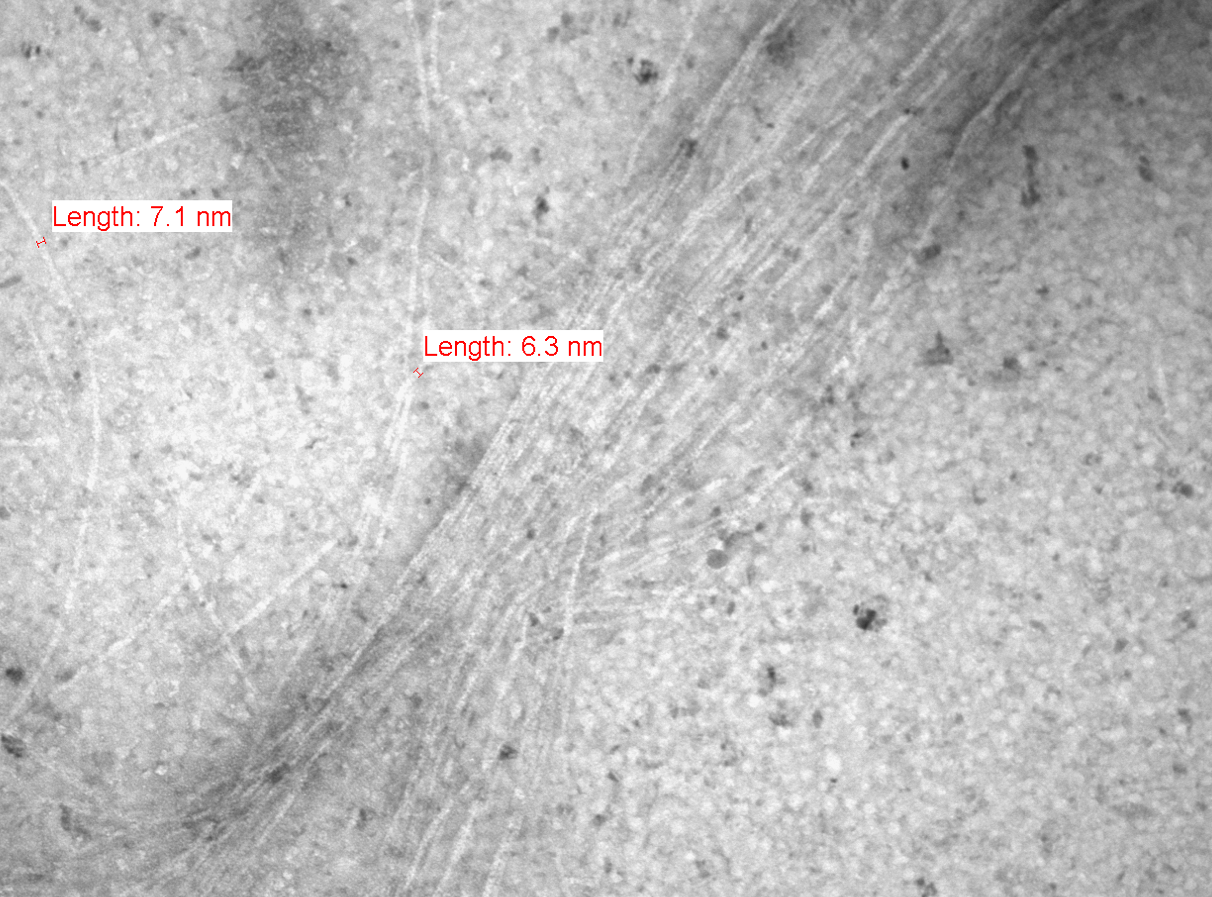
There appears to be molecular structure in these images! In my experience people need to label with larger actin binding proteins to see this type of structure. I know Karen is doing some comparisons on carbon grids.
Could be good.
Here is a useful web page on electron microscopy that uses actin filaments as a reference molecule. The good news is that I think our images show hints of the ‘rope-like’ actin structure you can see in Figure 1.8.
http://www.mih.unibas.ch/Booklet/Lecture/Chapter1/Chapter1.html