Pore tunability, consistency
In the last month, we’ve run several sets of 15 nm pnc-Si wafers over a range of RTP temperatures. Below is a chart that illustrates the current pore size control we have by tuning annealing temp.
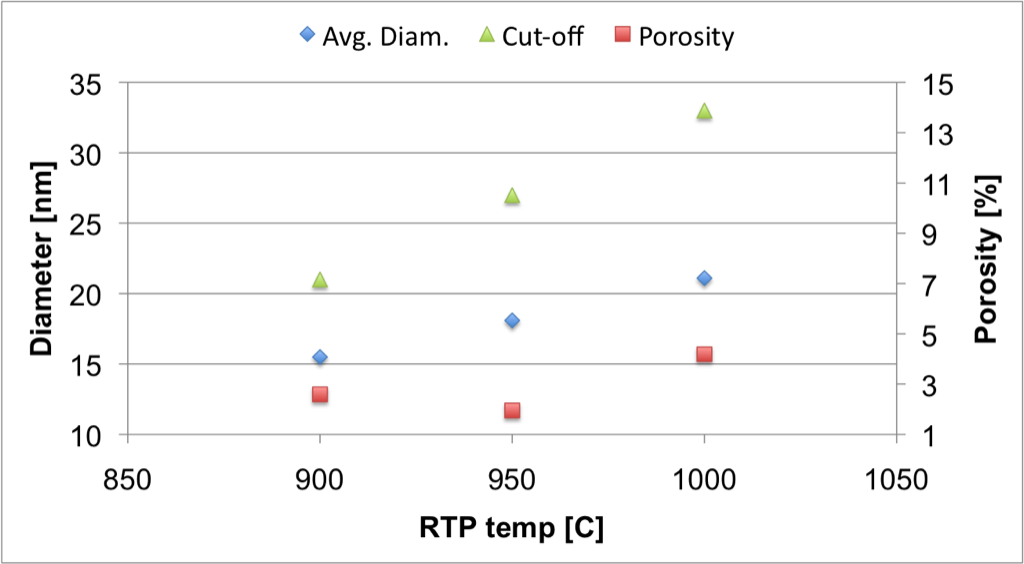
The 900 C, 950 C, and 1000 C samples were from wafers SC 231, SC 314, and SC 316, respectively. The avg diameter and cut-off seems to follow a linear trend over this range. As expected, the porosity increases sharply at the high temp anneal.
Inspired by some of Carrie’s posts, I looked at how the histograms were shaped in this temp series.
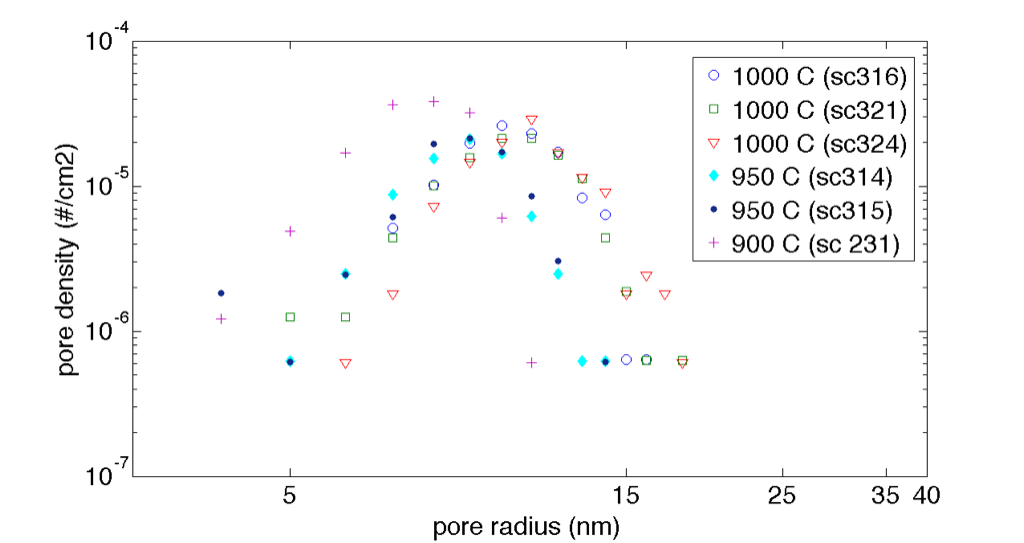
They all look parabolic. Maybe there’s a trend in the curvature?
Last week, a set of wafers was produced under identical deposition and annealing conditions (15 nm pnc-Si 1000 C 100 C/s anneal). These were meant mainly to test the progression of pinhole density over deposition order but also are useful to verify the consistency in nanostructure.
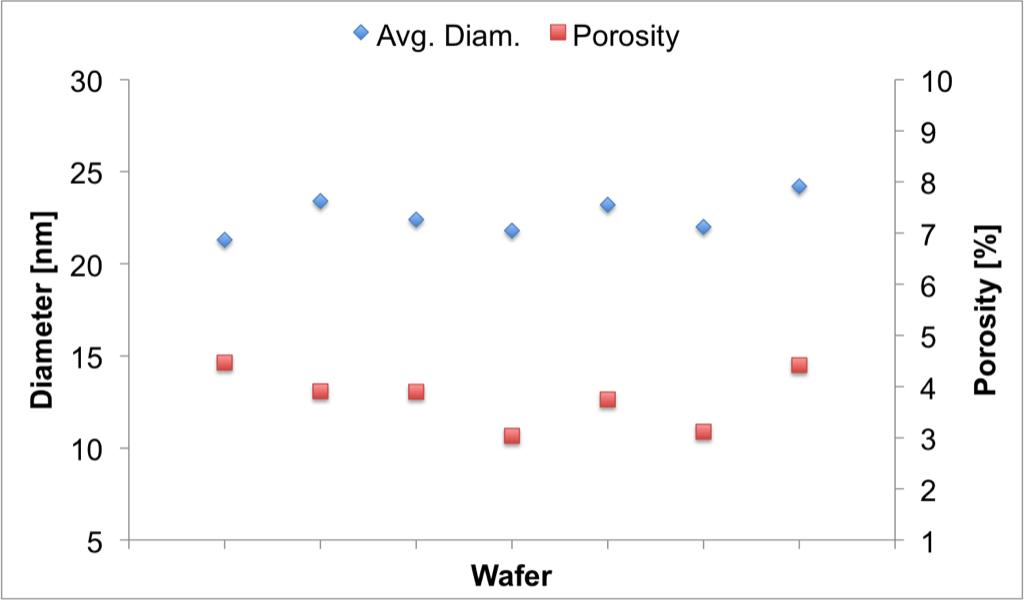
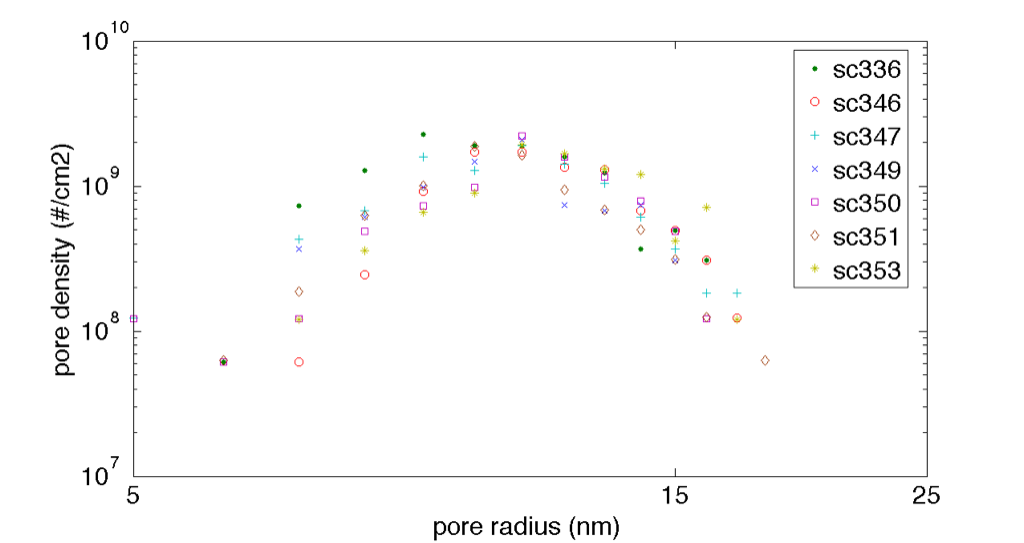
Overall, the porosity and avg diameter are all fairly close with std dev of 0.56 % and 0.82 nm, respectively. The density vs. radii plots show that the wafers were more consistent at larger pore sizes but this might also have to do with the pore recognition analysis.