Staphing Issues: Standardizing the Staphylococcus aureus µSiM-CA Division Assay
After continually seeing variability in assays using the microfluidic silicon membrane canalicular array (µSiM-CA) and developing a new technique to visualize bacterial division in the µSiM-CA, discussed here, we wanted to improve and stabilize the performance of our assays. Currently, the µSiM-CA is used by our lab, the Gill lab and the Dunman lab to perform similar assays while probing different biological questions. We all have similar protocols, but they are not exactly the same. Seeing this as a potential source for variability, we decided to standardize our protocols in order to establish a baseline performance for our assays with which we could improve upon. Once our protocols are standardized, we will look to make incremental changes to improve assay performance until we get to a point where we are satisfied (>90% transmission with positive controls). In this post, I will discuss our initial standardization attempt and our first protocol iteration.
Standardized Protocol
Becca, Vijay and I all got together and compared the protocols that we each use to do our respective assays with the µSiM-CA. Together we created the following protocol.
Preparing the µSiM-CAs for Testing and Loading them with Bacteria
- Ahead of time, prepare Tryptic Soy Broth (TSB) by adding 30 g of BBL Trypticase Soy Broth to 1 L of purified water
- Mix thoroughly and warm gently until powder is completely dissolved
- Autoclave at 121°C for 15 minutes
- Start an overnight culture by scraping up a chunk of glycerol stock with a pipette tip and adding it to 2 mL of TSB
- Take this overnight culture and put it into a shaker, shaking at 37°C overnight
- The next day, create a subculture by adding 1 mL of your overnight culture to 100 mL of TSB
- Put the subculture in a shaker and let grow at 37°C while shaking until it measures an OD between 0.2-0.4
- While the subculture is growing, thoroughly examine each µSiM-CA device you will use for any defects such as improper sealing between components or broken membranes
- Prepare petri dishes to hold µSiM-CA devices by placing 2 Kim Wipes moistened with sterile dH2O along the perimeter of each petri dish
- Pipette ~15 µL of TSB media by inserting the pipette tip into one of the two open ports of the µSiM-CA and depressing the plunger of the pipette; the media should flow from this port through the bottom channel and out the opposite, open port. Remove the pipette tip before releasing the plunger of the pipette to avoid sucking injected fluid back out of the bottom channel of the device
- Fill the well of the µSiM-CA by pipetting 100 µL of fresh TSB into it; care is taken to not create air bubbles and/or remove them by by withdrawing injected media and injecting it again until no air bubbles are visible
- With the bottom channel and well wet, block one of the open ports using a 3M double-sided tape sticker and stabilize the devices with clamps around its sides
- In the same manner as above, pipette ~40 µL of TSB media into the open port and look to see the well fill with little resistance. If resistance is appreciable, discard the device and prepare a new one
- Remove all liquid from the well (~140 µL), then add 15 mL of TSB into the open port
- Finally, add 100 µL of the desired OD subculture to the well of each device, withdrawing and injecting the subculture again if air bubbles are present until they are gone
- Allow the devices to incubate at 37°C for 6 hours
After loading, two different methods are used to gauge assay success. The first method, Colony Forming Unit (CFU) analysis, is used by Becca and Vijay. The second, confocal imaging, is used by myself. Both methods are described below.
Quantification of Bacterial Colonies from µSIM-CA Devices by Serial Dilution and CFU Plating:
- Ahead of time, prepare Tryptic Soy Agar (TSA) plates by adding 30 g of BBL Trypticase Soy Broth to 1 L of purified water
- Mix thoroughly and warm gently until powder is completely dissolved
- Add 15 g of agar to the TSB solution and mix thoroughly until powder is completely dissolved
- Autoclave at 121°C for 15 minutes
- After autoclaving, put the TSA solution into a 55°C water bath until cool enough to handle
- Pour TSA solution into petri dishes, covering the entire bottom of each
- Let filled petri dishes dry overnight, store long term at 4°C
- Prepare 96-well plates by adding 90 µL of 1x PBS to each well
- Aspirate 10 µL of culture from the bottom channel of the µSiM-CA and 10 µL from the top well of the µSiM-CA. Add each aliquot to different 1x PBS wells, creating 1:10 dilutions in the first row of the 96-well plate’s
- Mix each filled well thoroughly by pipetting up and down 20-40 times
- Transfer 10 µL from each well in the first row to the next row below and repeat step 3
- Continue this process for the remaining number of rows
- Next, using a multi-channel pipette, pipette 10 µL of each row of dilutions onto a correspondingly labeled TSA plates
- Pipette each dilution 4 times onto the same plate
- Incubate plates overnight at 37°C
- The following day, count CFUs
Confocal Imaging µSIM-CA Devices Containing GFP Tagged Staphylococcus aureus
- PDMS blocks (~5 mm thick) were laid on top of loaded µSiM-CA devices in order to allow them to be imaged in the microscopy core while maintaining gas permeance
- Any liquid pushed out to the sides of the device is wiped away with a Kim Wipe
- To create an adequate seal, the interface between the PDMS bottom and the acrylic top of the device was sealed with nail polish
- Upon sealing, devices were stored in petri dishes filled with wet Kim Wipes for transport over to river campus
- Once at the microscopy core, images were taken with the 60X water immersion objective and the 1.5X magnifier on the base of the confocal microscope. The 488 nm laser was used with the 525 nm filter
- While imaging, devices were stored in an incubator stage attached the confocal microscope which is held at 37°C
- In between imaging sessions, devices were stored in an oven held at 37°C containing two 1 L beakers of DI water
Results
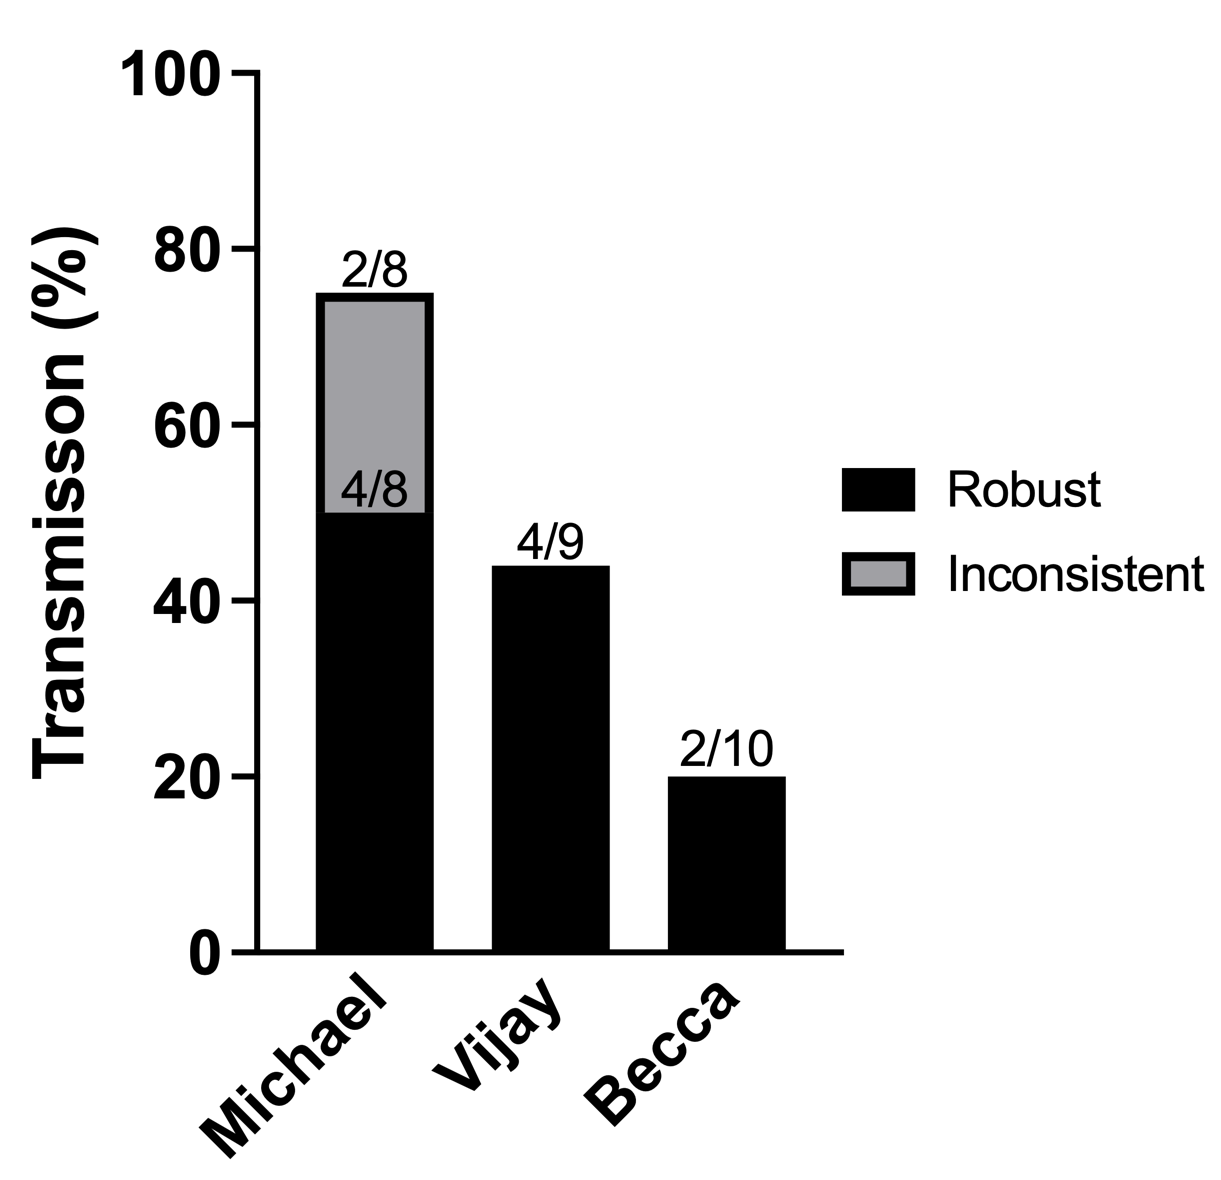
I built 30 µSiM-CA devices so that all three of us could take 10 to test separately. After each of us followed the aforementioned protocols, we achieved similar results (counting imaged devices only where an appreciable amount of bacteria was seen in the bottom channel). Shown in Figure 1 below, we each had a 50%, 44%, and 20% rate of transmission for an average of 38%. This became the baseline assay performance that we wished to improve.
Taking a closer look at the images I collected during this round, some interesting trends emerge. Figure 2 shows three different views (first the membrane at 60X, then at 90X and finally a 3D view in between the membrane at the top and the bottom channel at the bottom) for each of the ten devices I worked with at four different time points. Three of the time points were within our assay time (one, four and six hours) and the last time point was at 24 hours.
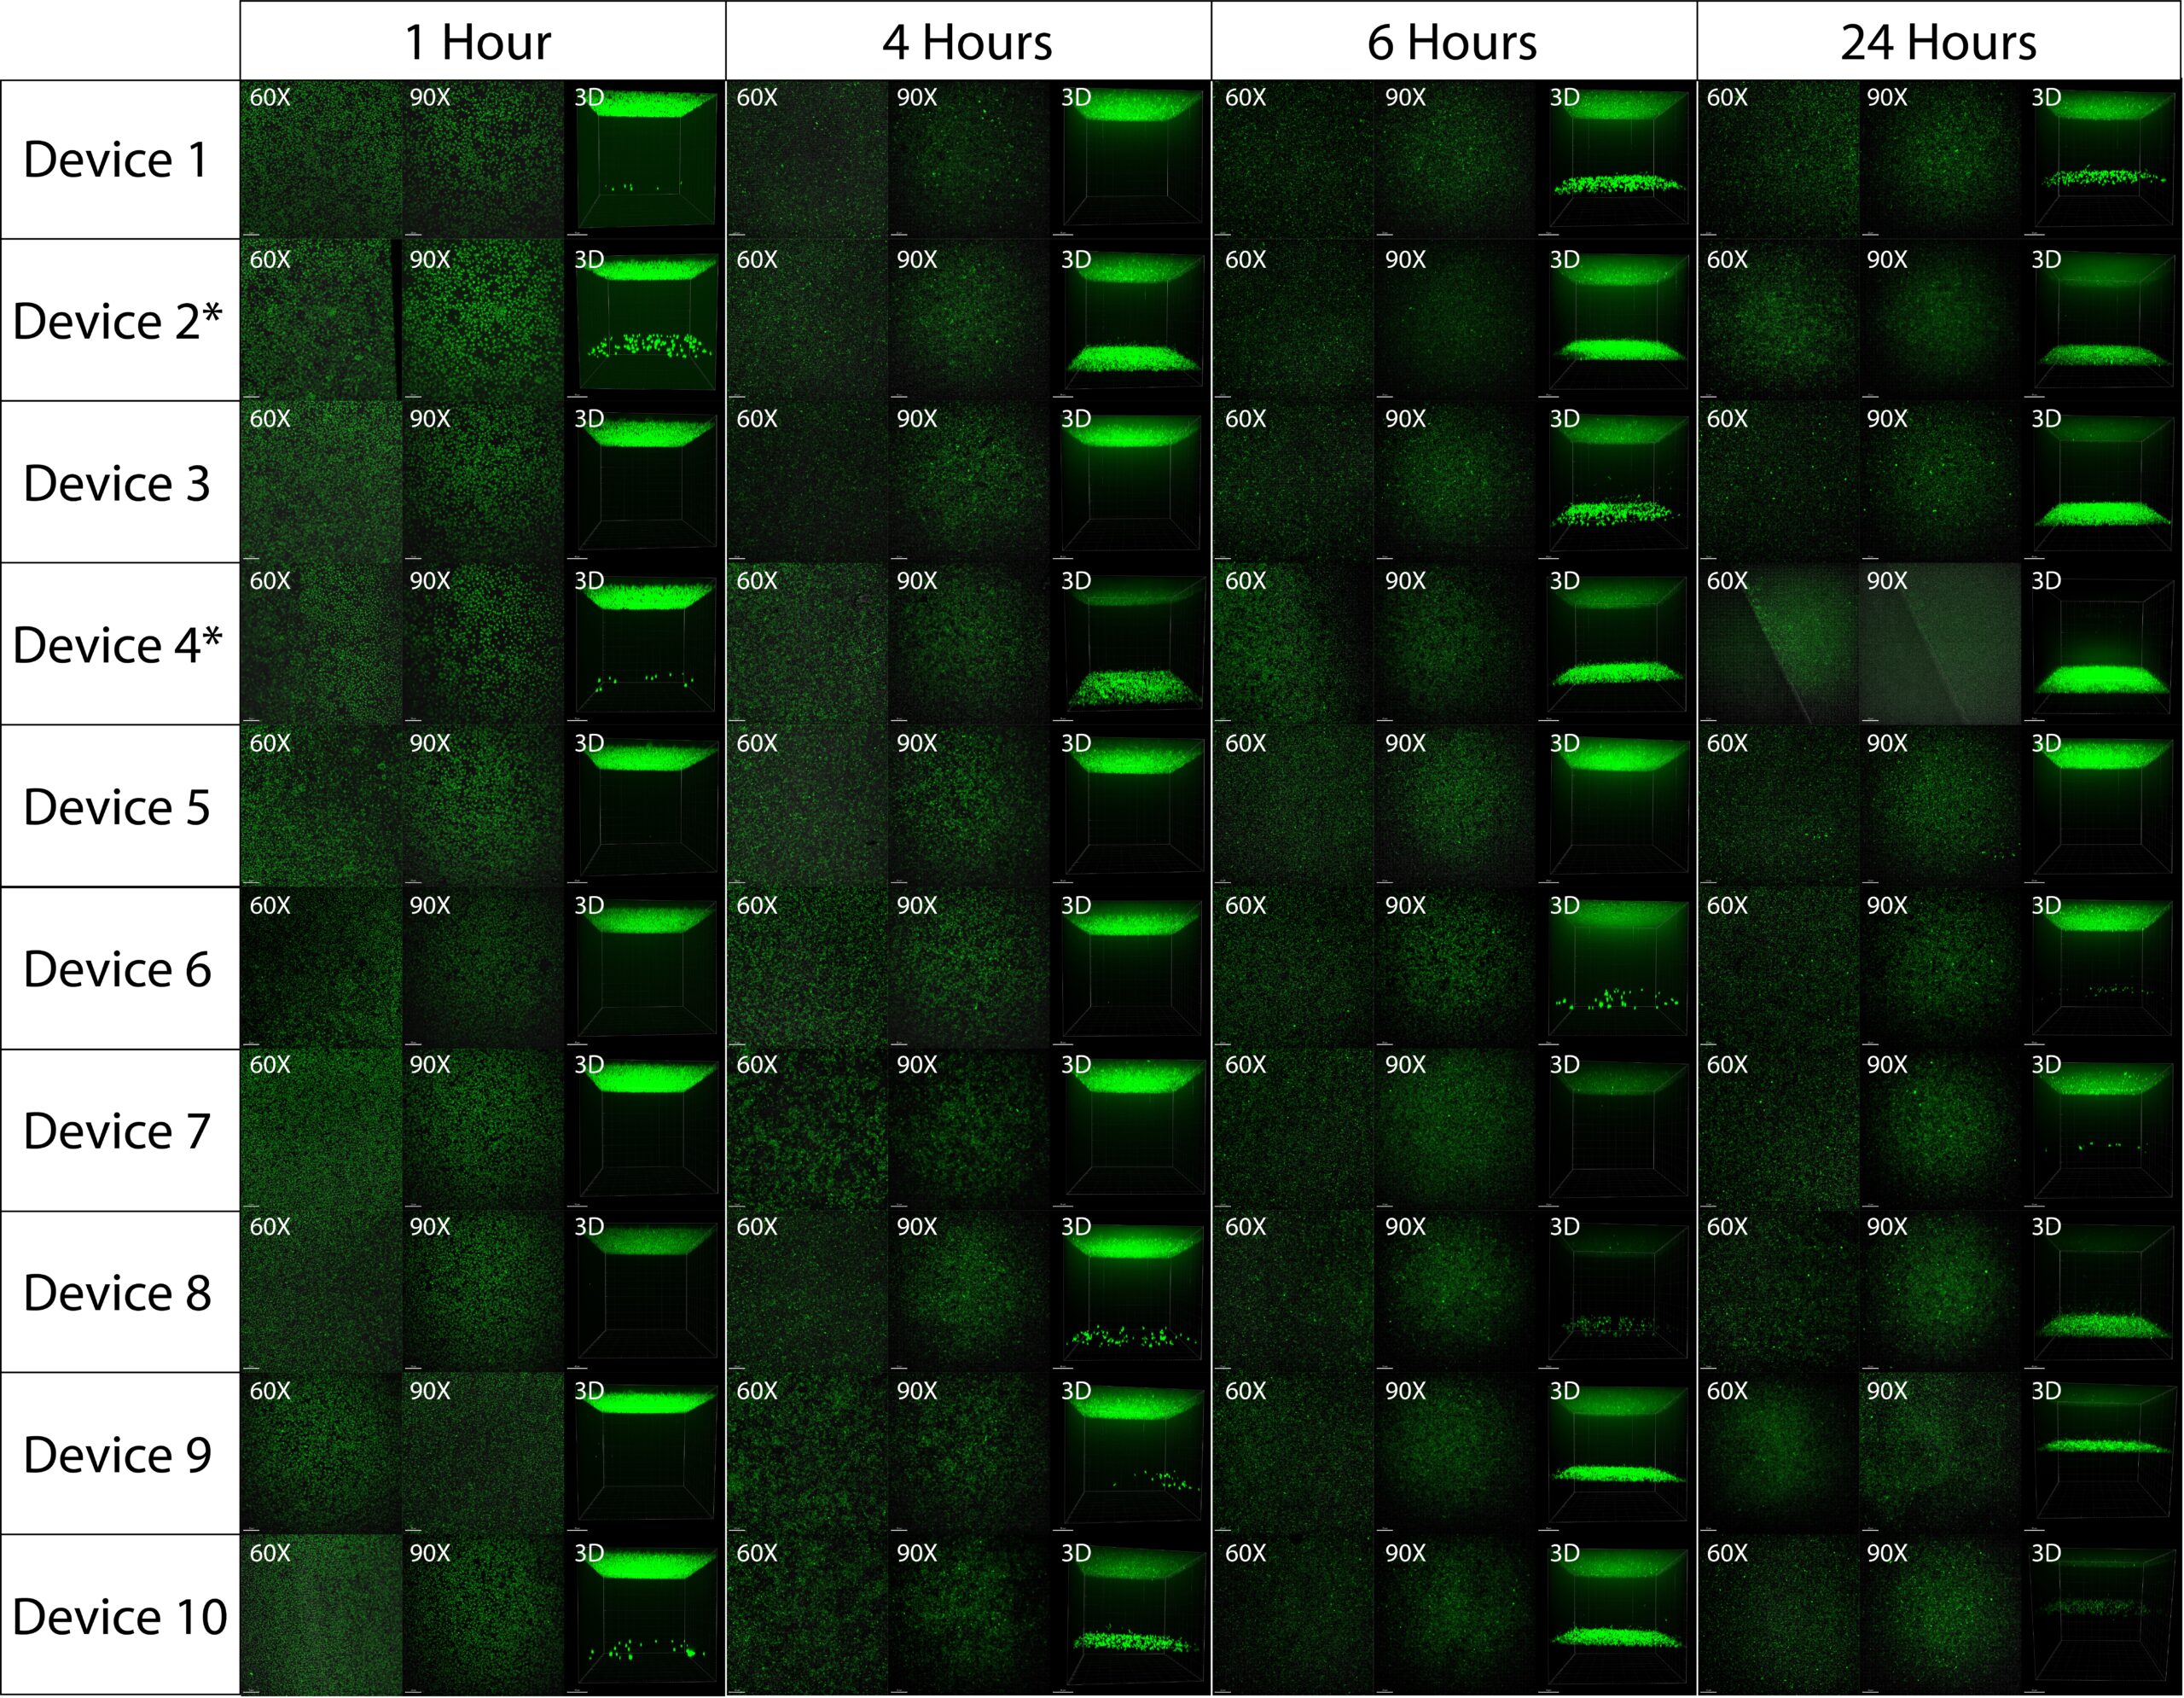
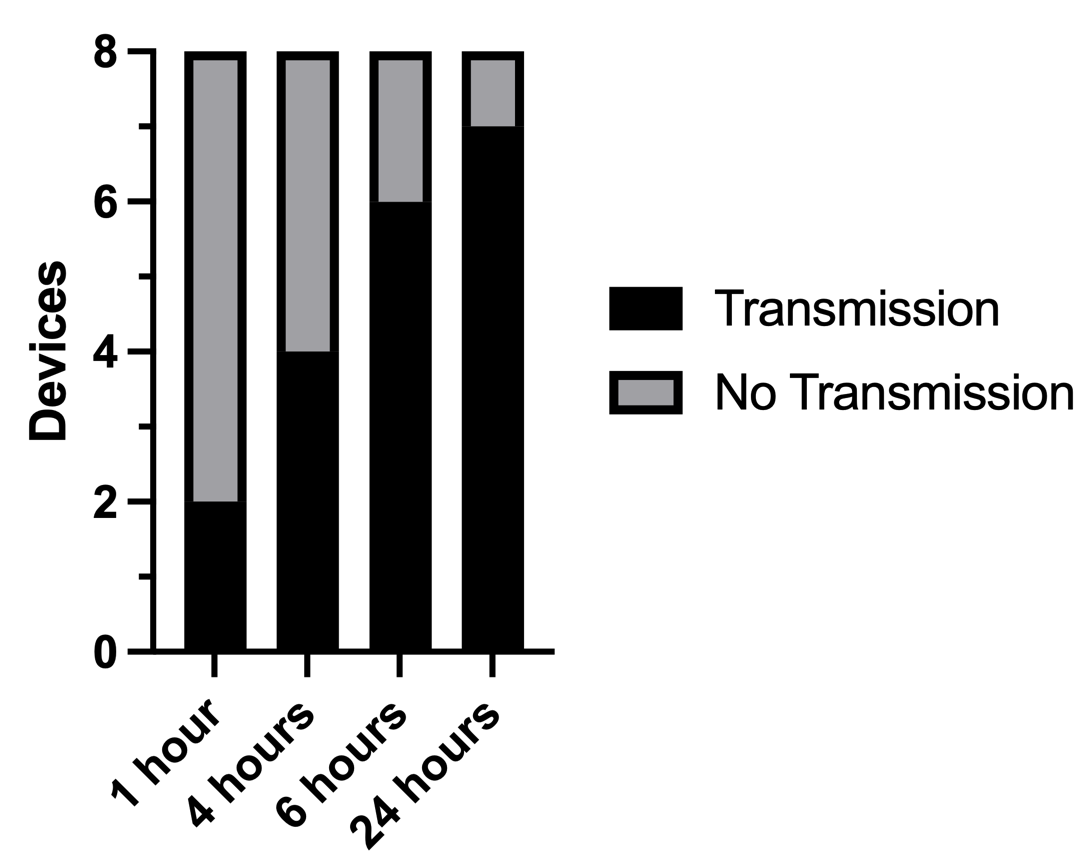
Two of the devices had broken membranes from the start (Device 2 and Device 4). These both predictably had bacteria in the bottom channels within one hour and by far showed the most growth in the bottom channel over time. Interestingly, two devices with intact membranes had bacteria through their membranes within an hour as well (Devices 1 and 10). After four hours, two more devices had bacteria in the bottom channel (Devices 8 and 9) and after six hours two more devices has bacteria in the bottom channel (Devices 3 and 6). Altogether within six hours, six out of the eight devices with intact membranes had bacteria in their bottom channels. I let all ten devices continue to incubate for 24 hours just to see if bacteria would get into the bottom channels of either of the devices that did not have bacteria in their bottom channels within six hours. Interestingly, bacteria did end up getting into the bottom channel of one of these devices (Device 7). A summary of bacterial transmission over time is shown in Figure 3.
Looking at the images of the membranes in the two devices that did not have bacteria go through within six hours, evidence of clumping that is not present on most of the other membranes can be seen. This could provide a potential reason as to why bacteria did not go through the membrane. Nonetheless, at this point we thought our issues could be caused by wetting variability. To address this we modified the protocol slightly for our next attempt.
First Protocol Iteration
Our first iteration added one step to the beginning of our original protocol. To allow the membrane to wet more easily we treated the assembled devices with a plasma wand. The plasma increased the surface energy of the membrane, decreasing the contact angle of water on its surface. After adding this step, the protocol was as follows:
Preparing the µSiM-CAs for Testing and Loading them with Bacteria
- Ahead of time, prepare Tryptic Soy Broth (TSB) by adding 30 g of BBL Trypticase Soy Broth to 1 L of purified water
- Mix thoroughly and warm gently until powder is completely dissolved
- Autoclave at 121°C for 15 minutes
- Start an overnight culture by scraping up a chunk of glycerol stock with a pipette tip and adding it to 2 mL of TSB
- Take this overnight culture and put it into a shaker, shaking at 37°C overnight
- The next day, create a subculture by adding 1 mL of your overnight culture to 100 mL of TSB
- Put the subculture in a shaker and let grow at 37°C while shaking until it measures an OD between 0.2-0.4
- While the subculture is growing, thoroughly examine each µSiM-CA device you will use for any defects such as improper sealing between components or broken membranes
- Prepare petri dishes to hold µSiM-CA devices by placing 2 Kim Wipes moistened with sterile dH2O along the perimeter of each petri dish
- Turn the plasma wand on and hold it half an inch above assembled µSiM-CA’s for 1 minute each
- Pipette ~15 µL of TSB media by inserting the pipette tip into one of the two open ports of the µSiM-CA and depressing the plunger of the pipette; the media should flow from this port through the bottom channel and out the opposite, open port. Remove the pipette tip before releasing the plunger of the pipette to avoid sucking injected fluid back out of the bottom channel of the device
- Fill the well of the µSiM-CA by pipetting 100 µL of fresh TSB into it; care is taken to not create air bubbles and/or remove them by by withdrawing injected media and injecting it again until no air bubbles are visible
- With the bottom channel and well wet, block one of the open ports using a 3M double-sided tape sticker and stabilize the devices with clamps around its sides
- In the same manner as above, pipette ~40 µL of TSB media into the open port and look to see the well fill with little resistance. If resistance is appreciable, discard the device and prepare a new one
- Remove all liquid from the well (~140 µL), then add 15 mL of TSB into the open port
- Finally, add 100 µL of the desired OD subculture to the well of each device, withdrawing and injecting the subculture again if air bubbles are present until they are gone
- Allow the devices to incubate at 37°C for 6 hours
Both the CFU protocol and the confocal protocol were the same as our first attempt.
Results
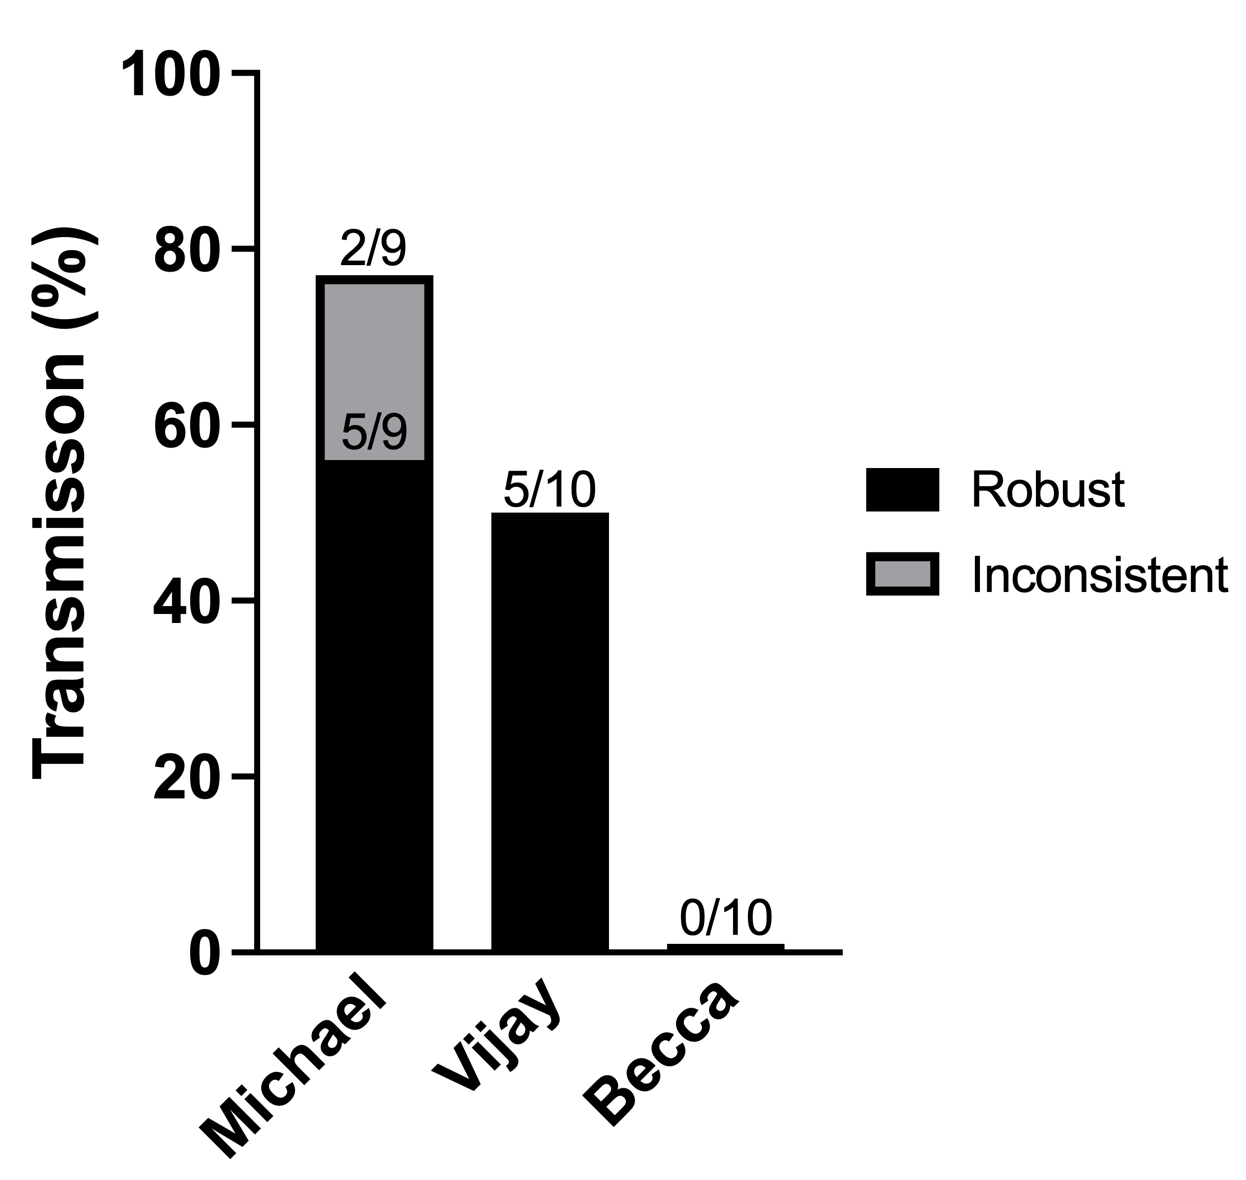
I again built 30 µSiM-CA devices so that all three of us could take 10 to test separately. After each of us followed the aforementioned protocols, we achieved results that were slightly more varied than our first attempt (counting imaged devices only where an appreciable amount of bacteria was seen in the bottom channel). Shown in Figure 4 below, we each had a 56%, 50%, and 0% rate of transmission for an average of 35%. This is 3% lower than our first attempt., therefore wetting does not seem to be our issue.
Taking a closer look at the images I collected during this round, more interesting trends emerge and some previous trends were seen again. Figure 5 shows the same three views as were in Figure 2 for each of the ten devices I worked with at four different time points. Three of the time points were within our assay time (one, three and six hours) and the last time point was at 24 hours.
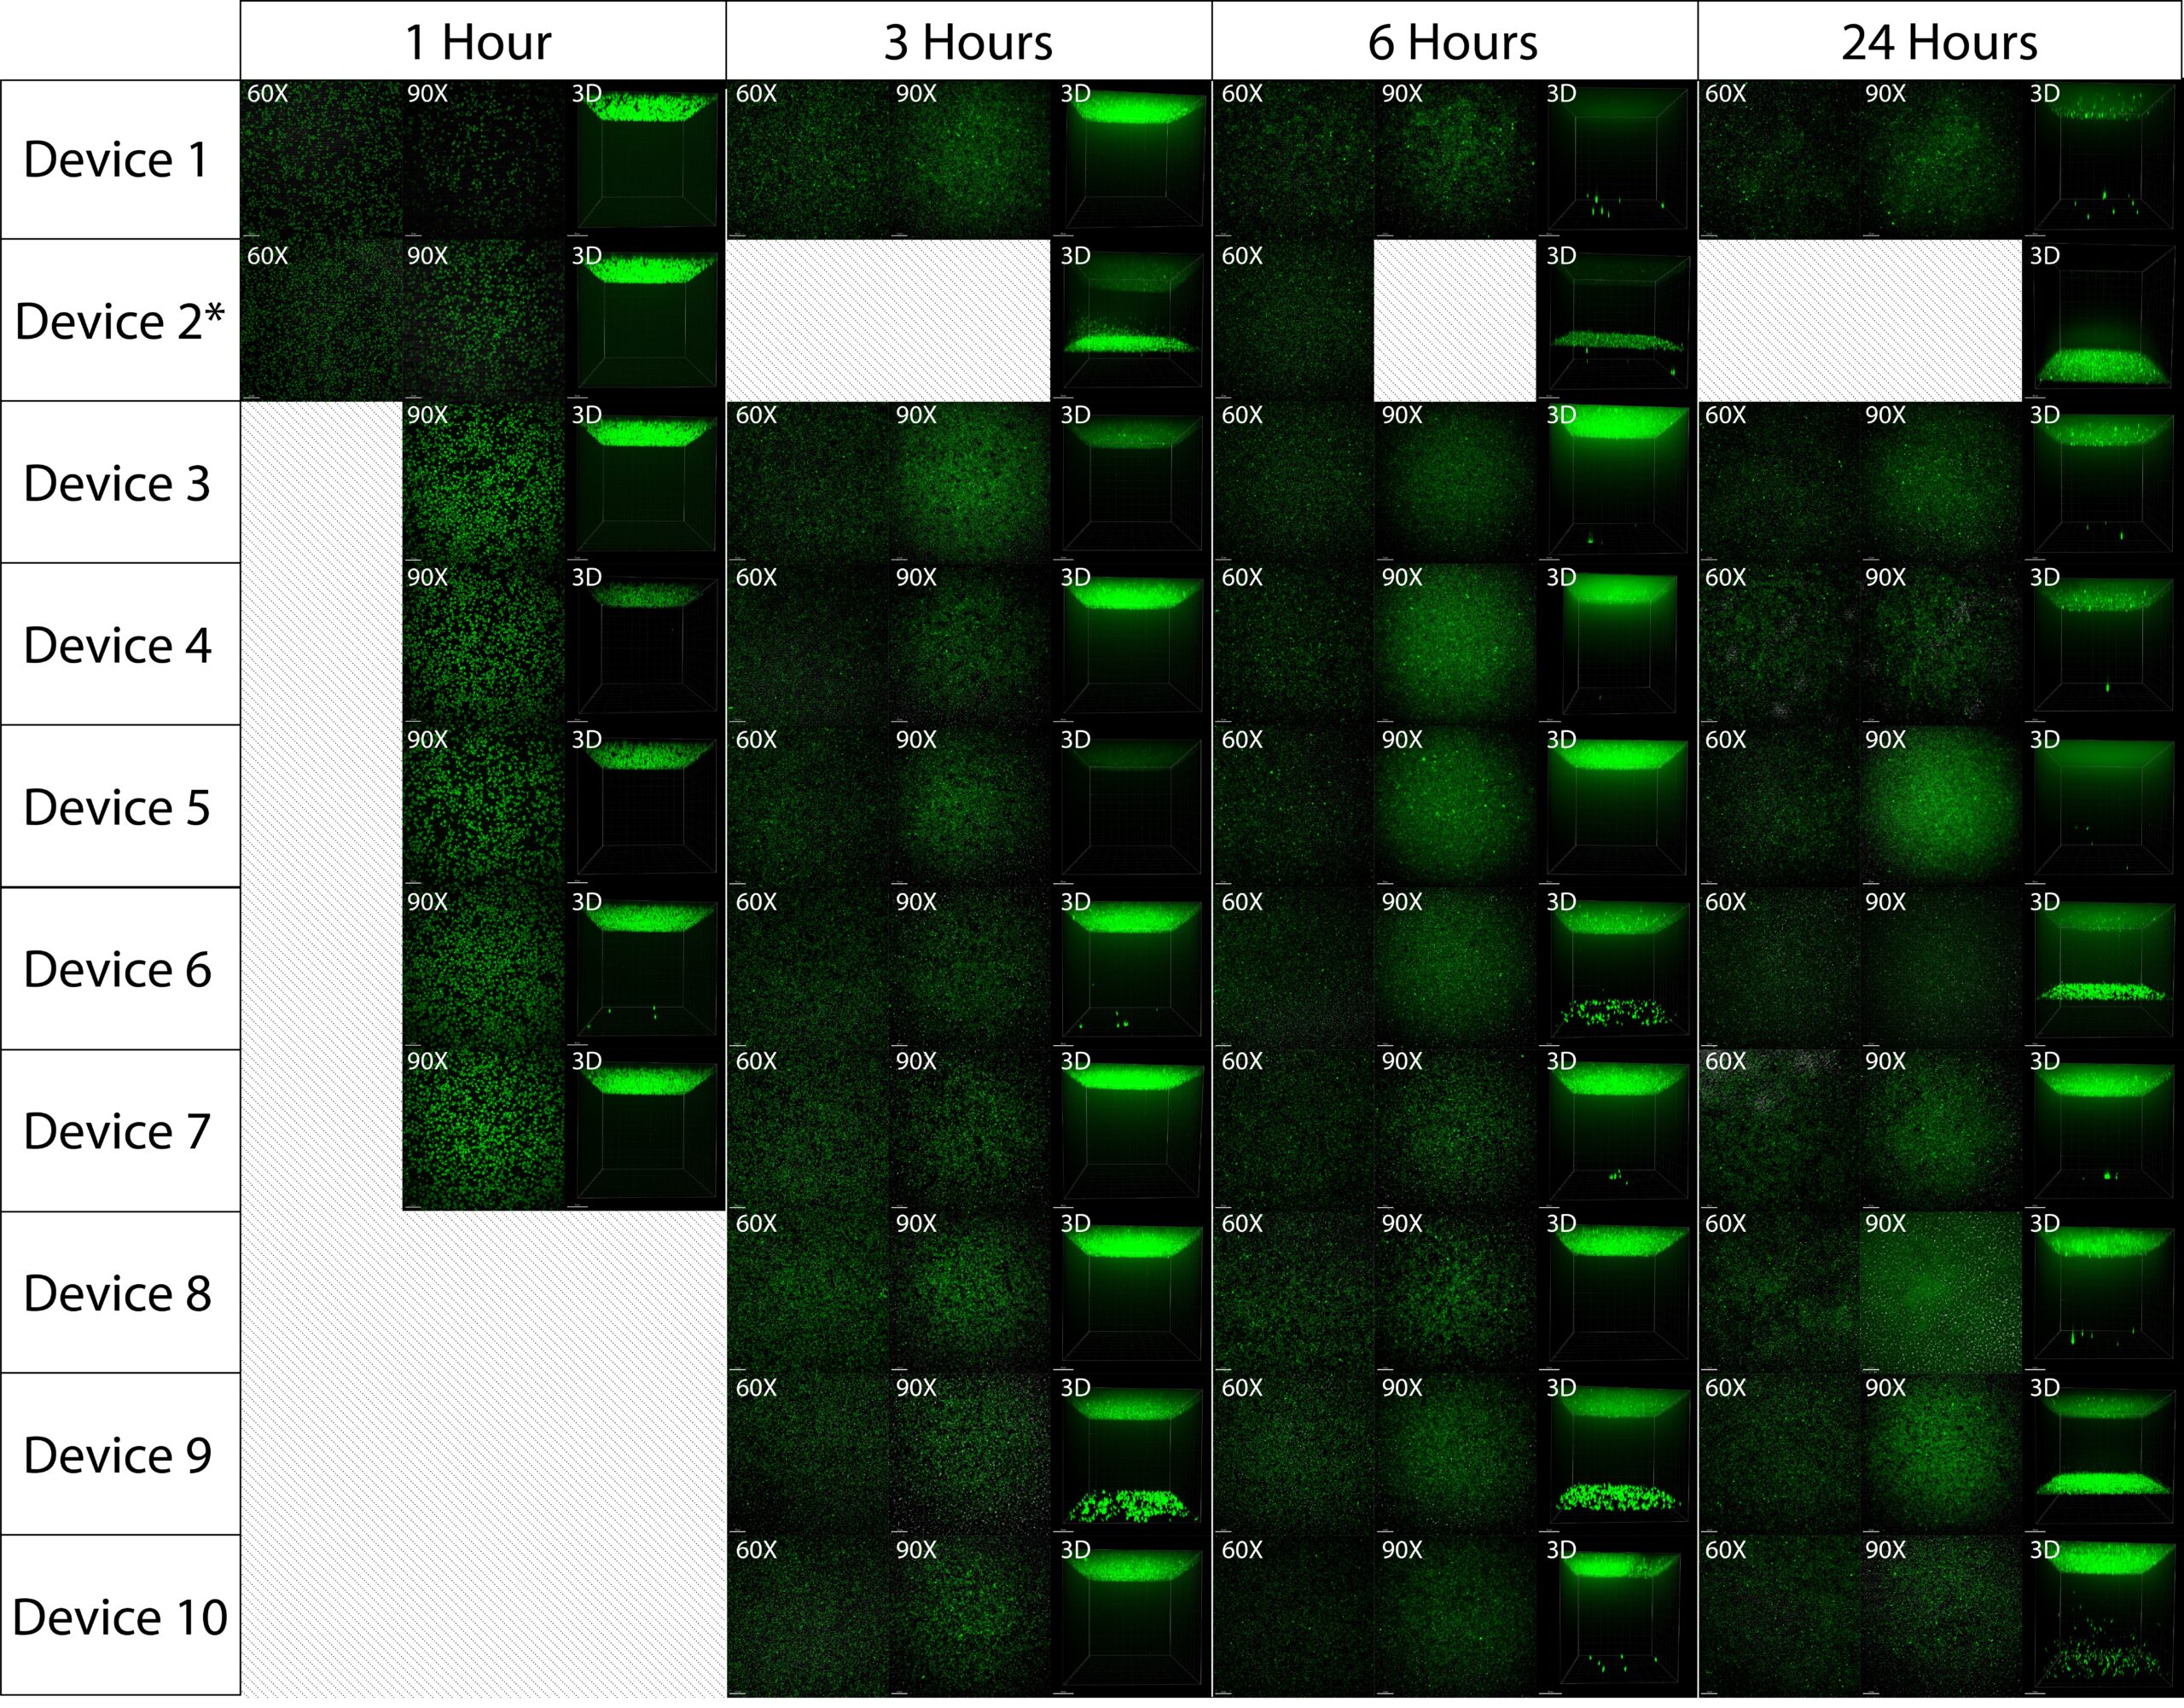
One device had a broken membrane from the start (Device 2). This device again showed the most growth in the bottom channel over time out of all of the devices. I was unable to image every device at my first time point, but I did still see that one device with an intact membrane had bacteria through its membrane within one hour (Devices 6). After three hours, one more device had bacteria in the bottom channel (Devices 9) and after six hours five more devices has bacteria in the bottom channel (Devices 1, 3, 4, 7 and 10). Altogether within six hours, seven out of the nine devices with intact membranes had bacteria in their bottom channels. I again let all ten devices continue to incubate for 24 hours just to see if bacteria would get into the bottom channels of either of the devices that did not have bacteria in their bottom channels within six hours. Interestingly and somewhat similar to our first attempt, bacteria did end up getting into the bottom channel of both of these devices (Device 5 and 8). A summary of bacterial transmission over time is shown in Figure 6.
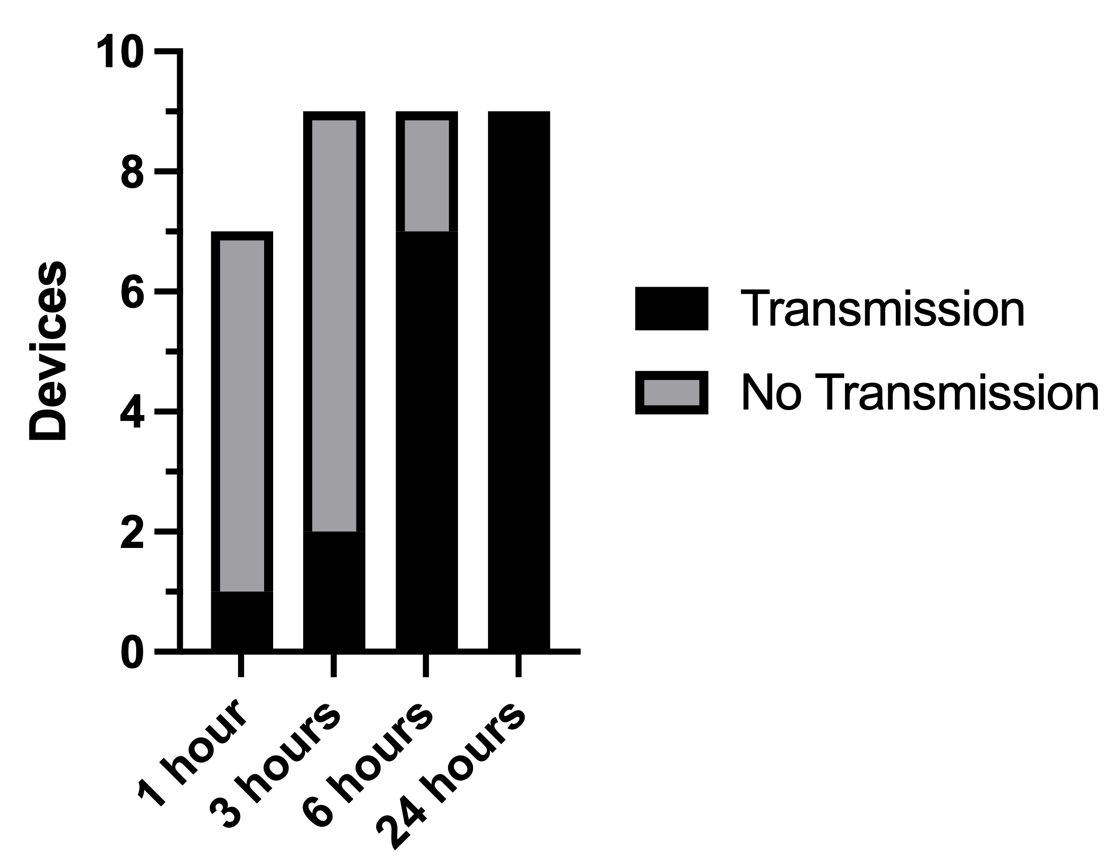
Looking at the images of the membranes in the two devices that did not have bacteria go through within six hours, the density of bacteria seems to be higher than the other devices. This could provide another potential reason as to why bacteria did not go through the membrane.
Conclusions and Future Directions
After completing both rounds of tests, we re-affirmed that our assay is not robust and showed that our assay performance is not seemingly related to wetting issues. While reaching these conclusions, we did see some evidence which suggests a biological reason as to why bacteria goes through some devices within six hours and other times it does not. Clumping and higher bacterial densities on the membrane potentially suggest the formation of biofilms. Biofilms could prevent bacteria from finding the pores. If more evidence is collected moving forward which suggests pore discovery is an important first step to getting to the other side of the membrane, it might make sense that the bacteria in devices that do not get to the bottom channel are blocked from doing so by other bacteria which are forming bio-films. This is what we will investigate moving forward.