Burst Pressures (w187, 189, 310, 312)
These are the graphs with burst pressures for wafers 187, 189, 310, 312 and updated burst pressure book
Membrane_Burst_Book.xls
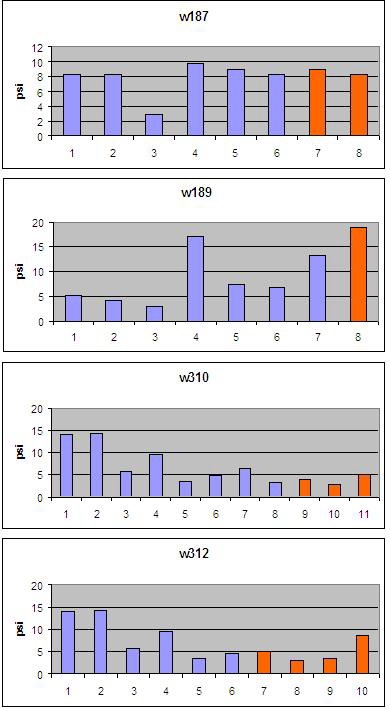
The orange columns in the graphs indicate samples that I used for air permeability tests before.
Thanks Maryna. I’m glad to see that we are breaking the 10 PSI barrier again!! Do the numbers on the x-axis correspond to position on the wafer? I assume the the stronger samples are from the center, where the porosity is lower?
Please let us know. Thanks!!
X-axis numbers don’t correspond to position but most of the “over 10psi results” are form the samples close to the center or in the center.
Maryna,
Could you label where the samples came from? It would be nice to see a trend based on the location from which the membranes came from!