Production from 12.13.2007
Production this week focused on varying the RTP temperature of membranes deposited under identical conditions.
wafer 316 – 800 C RTP (120 s)
 (1, 0) @ 50kx
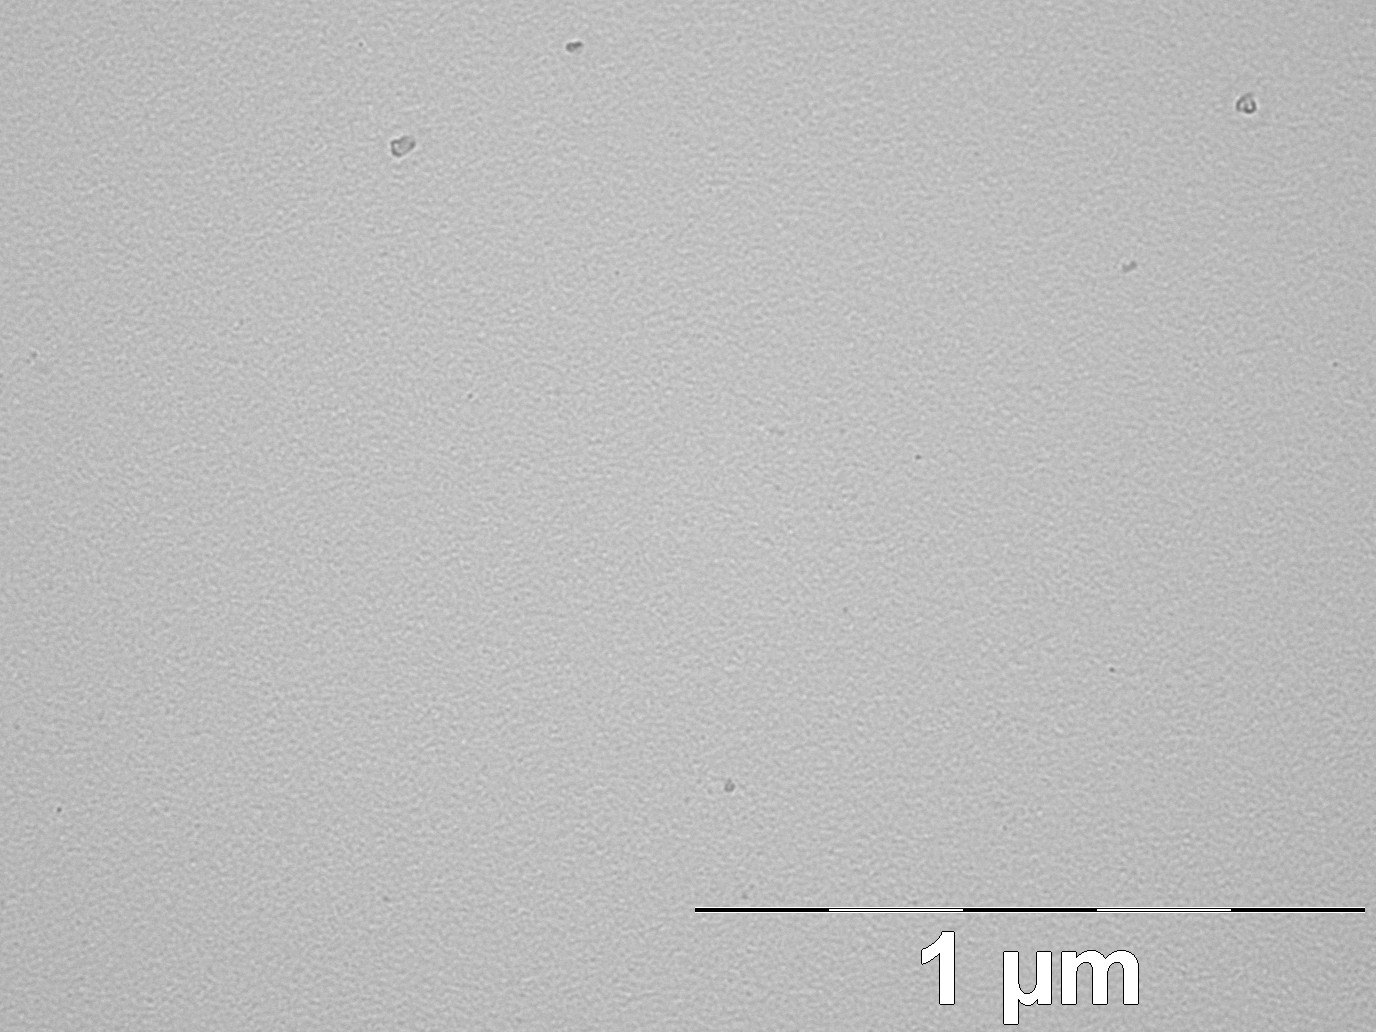 (0,-5) @ 50 kx
Material still appears to be amorphous. Wrinkled at edges.
wafer 318 – 900 C RTP (120 s)
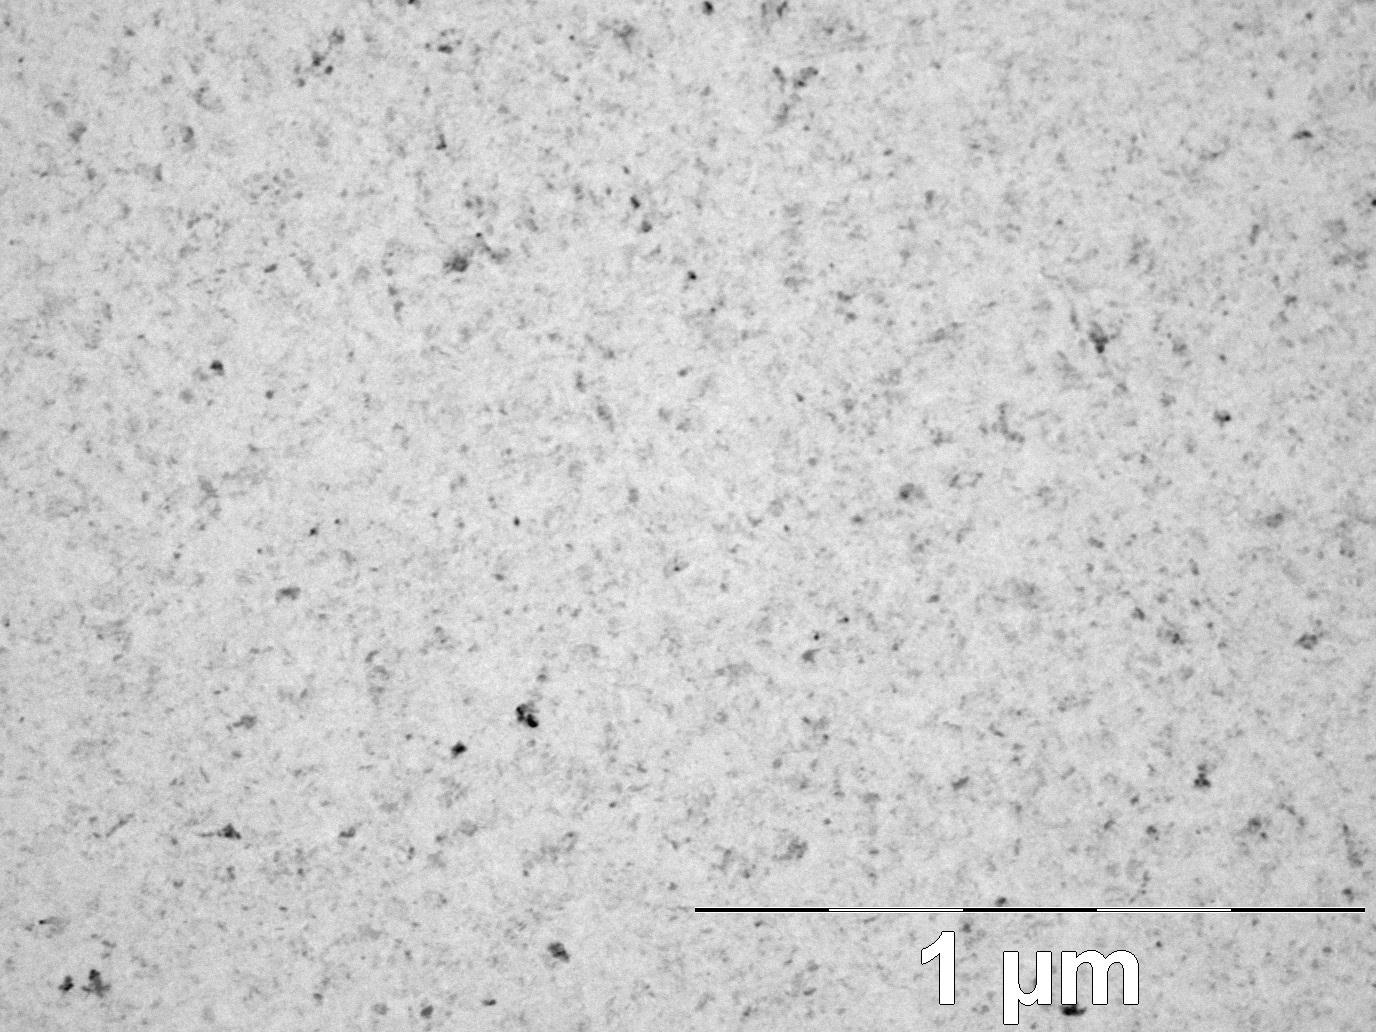 (0, 0) @ 50kx
 (-5, 0) @ 50kx
A few, very small pores.
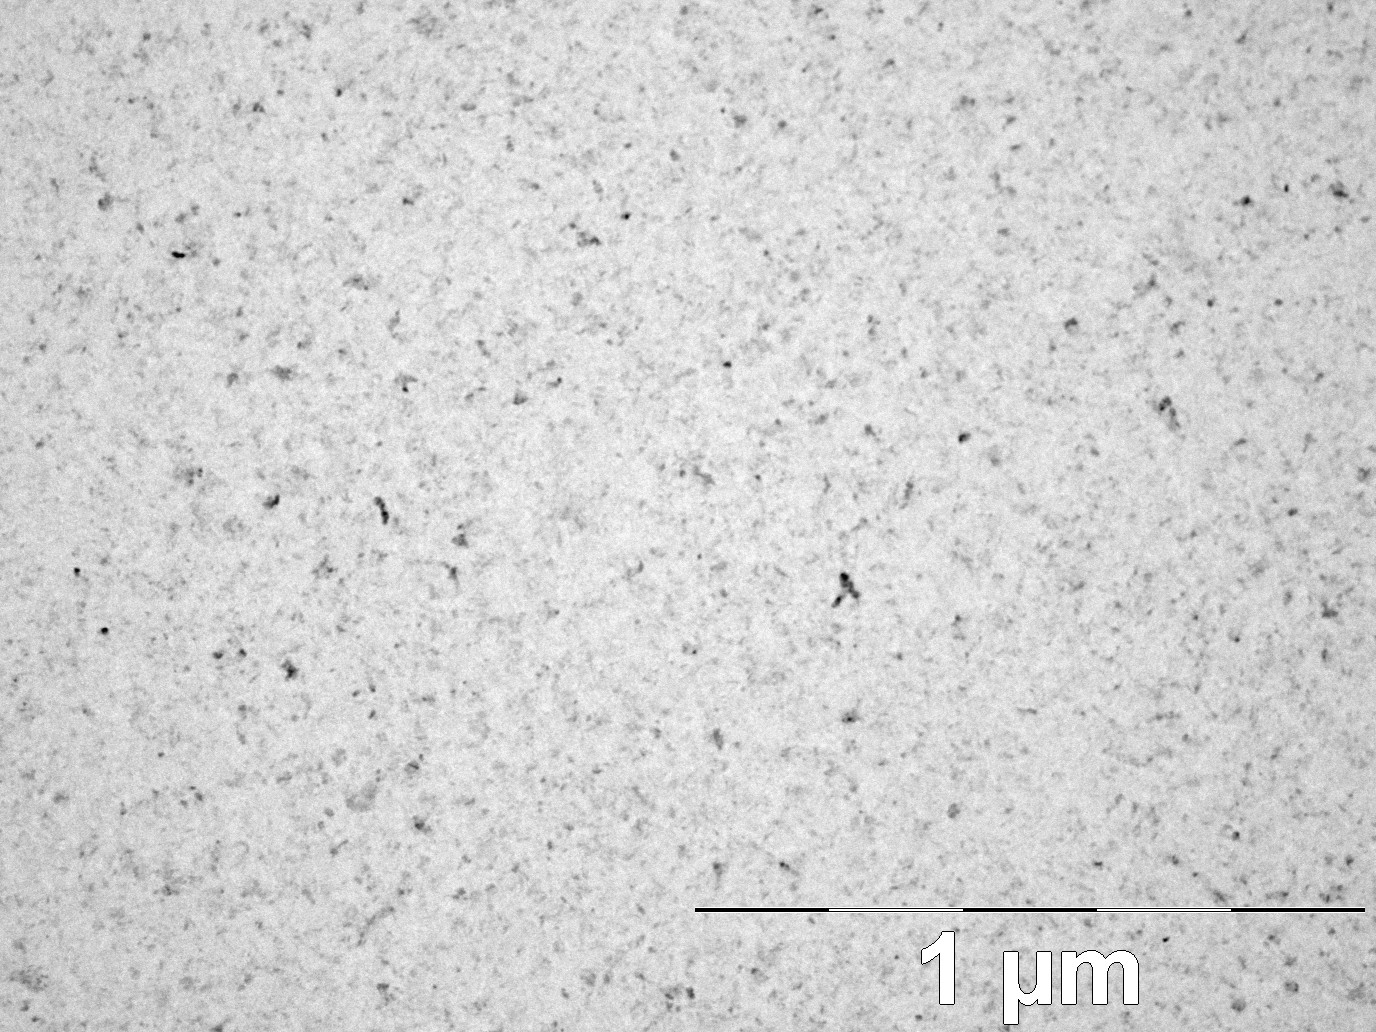
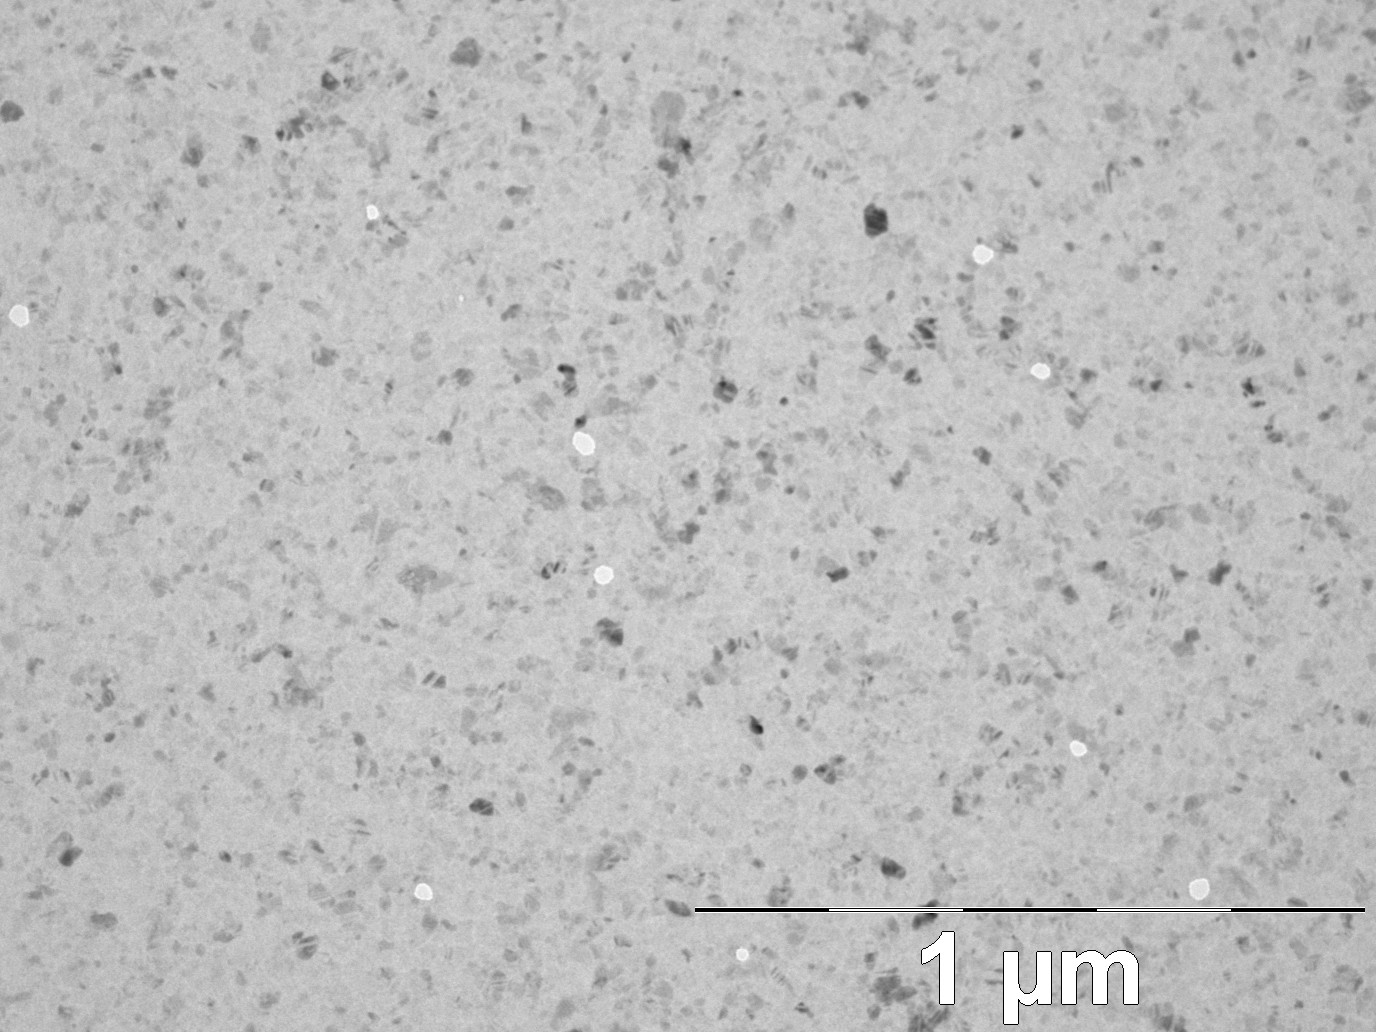
wafer 319 – 1000 C RTP (120 s)
 (0, 0) @ 50kx
 (5, 0) @ 50kx
Notice we’ve lost the small pore background.
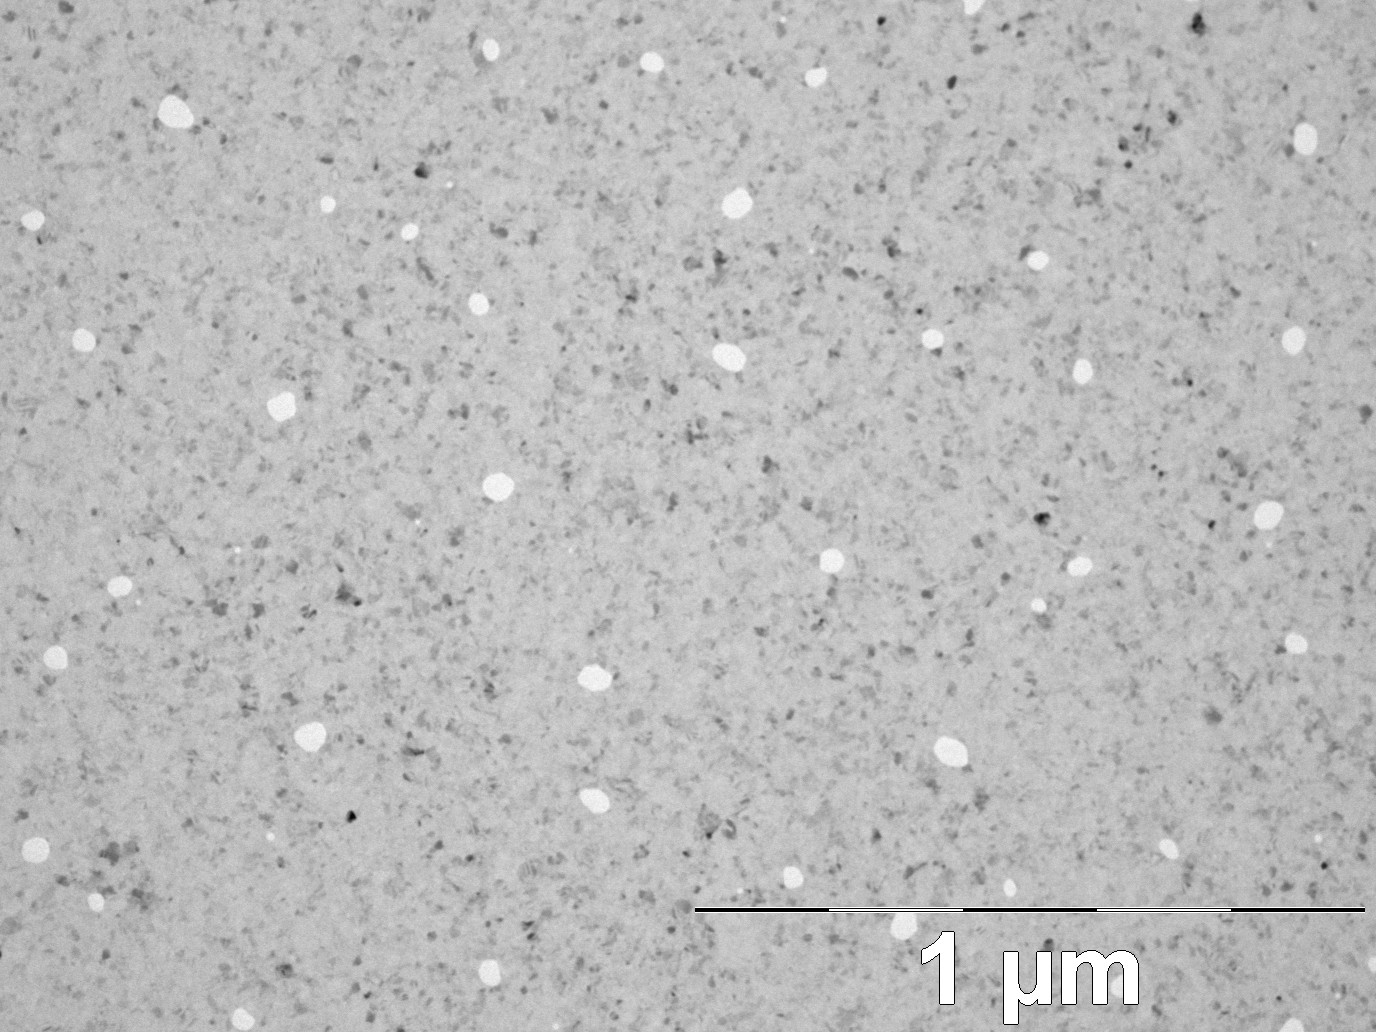
wafer 320 – 1100 C RTP (40 s, equip. fault)
 (1, 0) @ 50kx
 (0, -5) @ 50kx
Sample RTPed for 40 s (vs. 120 s) due to equipment fault. Membranes still wrinkled after 60 s + 30 s B.O.E. etch (indicator of membrane oxidation at high temp).
Dave – can you verify the result from w319 with the higher pore density in the center? I thought we had observed this effect in another set of wafers, maybe a few weeks ago? If you know which samples were imaged, you could probably just do a color-match to the original wafer positions. Otherwise, it’s worth a quick look on Brian’s TEM.
Thanks!!
The inner and outer samples from wafer 319 were indeed switched. I looked at them again under Brian’s TEM and verified that the outer samples had a higher density of pores, not the other way around as reported during this week’s meeting. This is consistent with our previous observations. Phew.