Characterization of the CAD-LB: Dynamic Range & Capture Efficiency
Introduction
This post is meant to serve as an update for some of the more recent work completed on the CAD-LB (catch and display for liquid biopsy) platform. The CAD-LB is intended to be used as a digital biomarker assay for interrogating small extracellular vesicles (sEVs). Since transitioning our assay to the µSIM device we worked to rigorously characterize the performance and limitations of the CAD-LB. This post details some of this characterization as we define parameters like capture efficiency and dynamic range using input solutions of varying complexity.
Experimental Approach
Nanoparticle/sEV Capture
To remind everyone how we use the µSIM device, I have included the figure below.
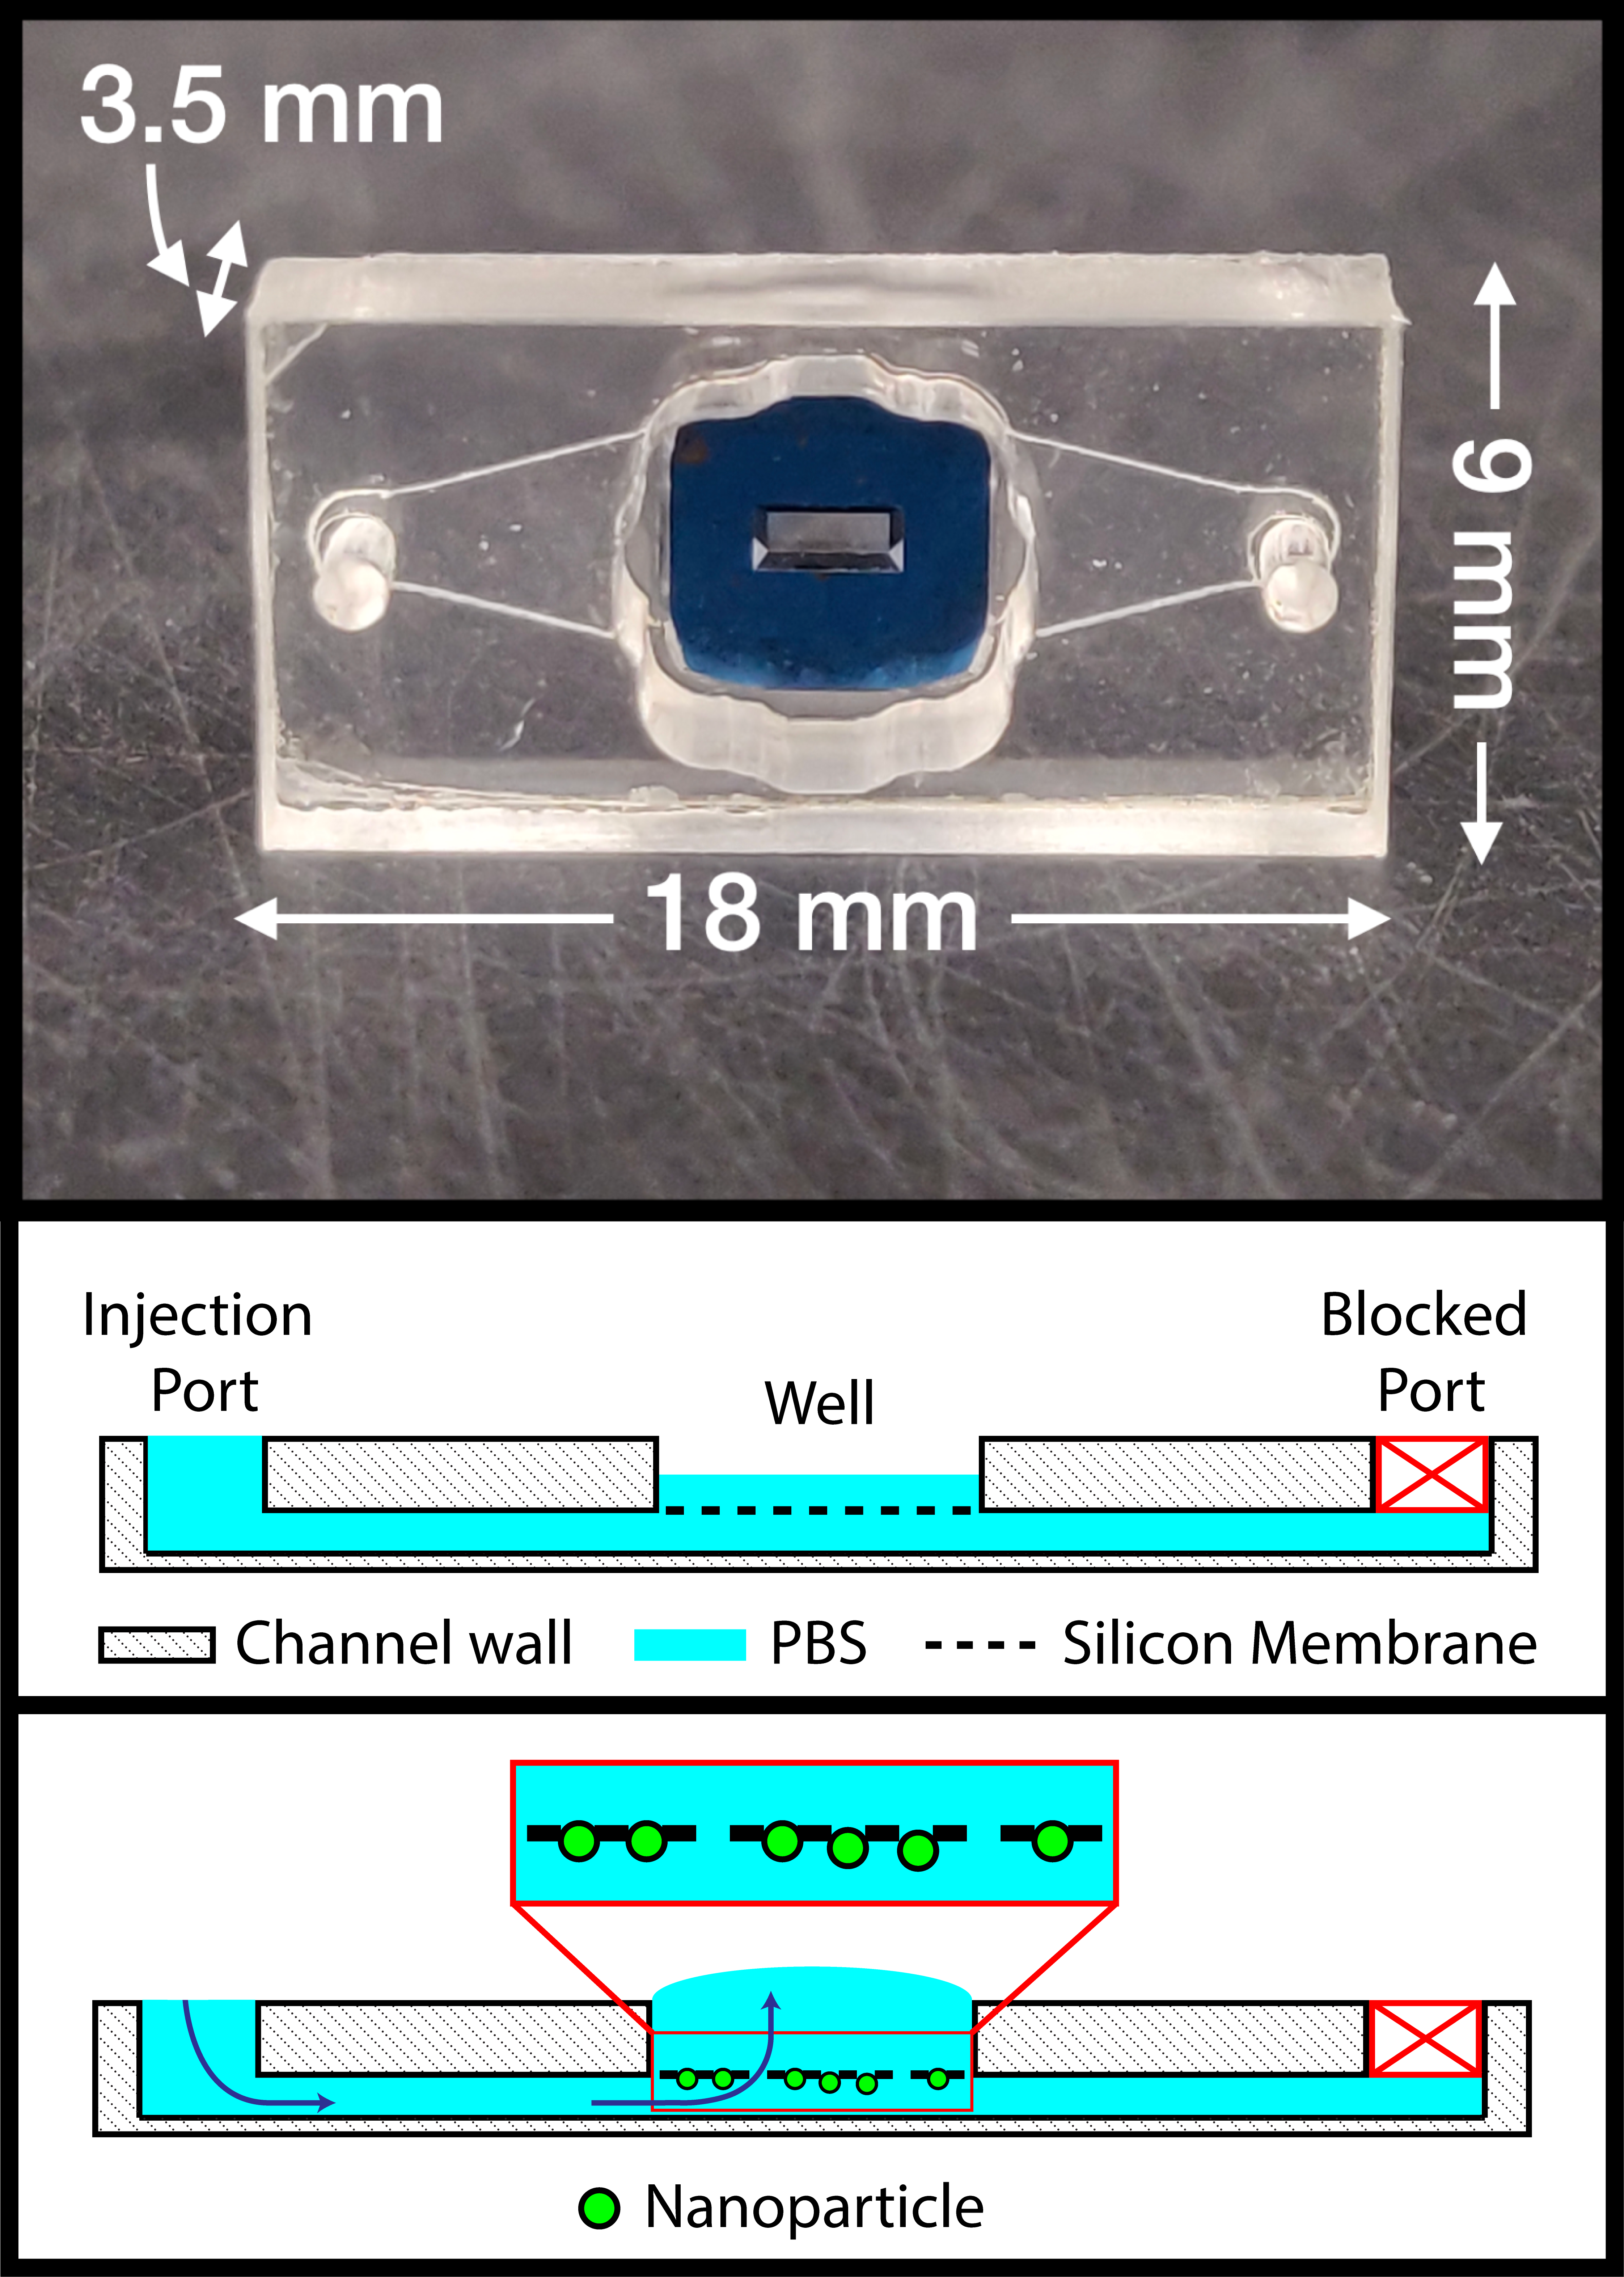
In this configuration, one port of the µSIM device is blocked and a small volume (40 µL) of sample is injected into the other port. This way we create a dead-end-like filtration flow scheme in which the species of interest (nanoparticles/sEVs) is captured beneath the membrane.
Nanoparticle/sEV Imaging & Quantification
Fluorescent nanoparticles or fluorescently labeled sEVs are imaged with a fluorescence confocal microscope and the resulting fluorescent signals are quantified with an open-source ImageJ plugin. sEVs are labeled with carboxyfluorescein succinimidyl ester (CFSE) or MemGlow 488 which should label the lumen and lipid bilayer components, respectively.
Results & Discussion
In an effort to define the dynamic range of the CAD-LB, 100 nm fluorescent nanoparticles were captured, imaged and quantified. The quantification results and an accompanying error analysis are presented in Figure 2.
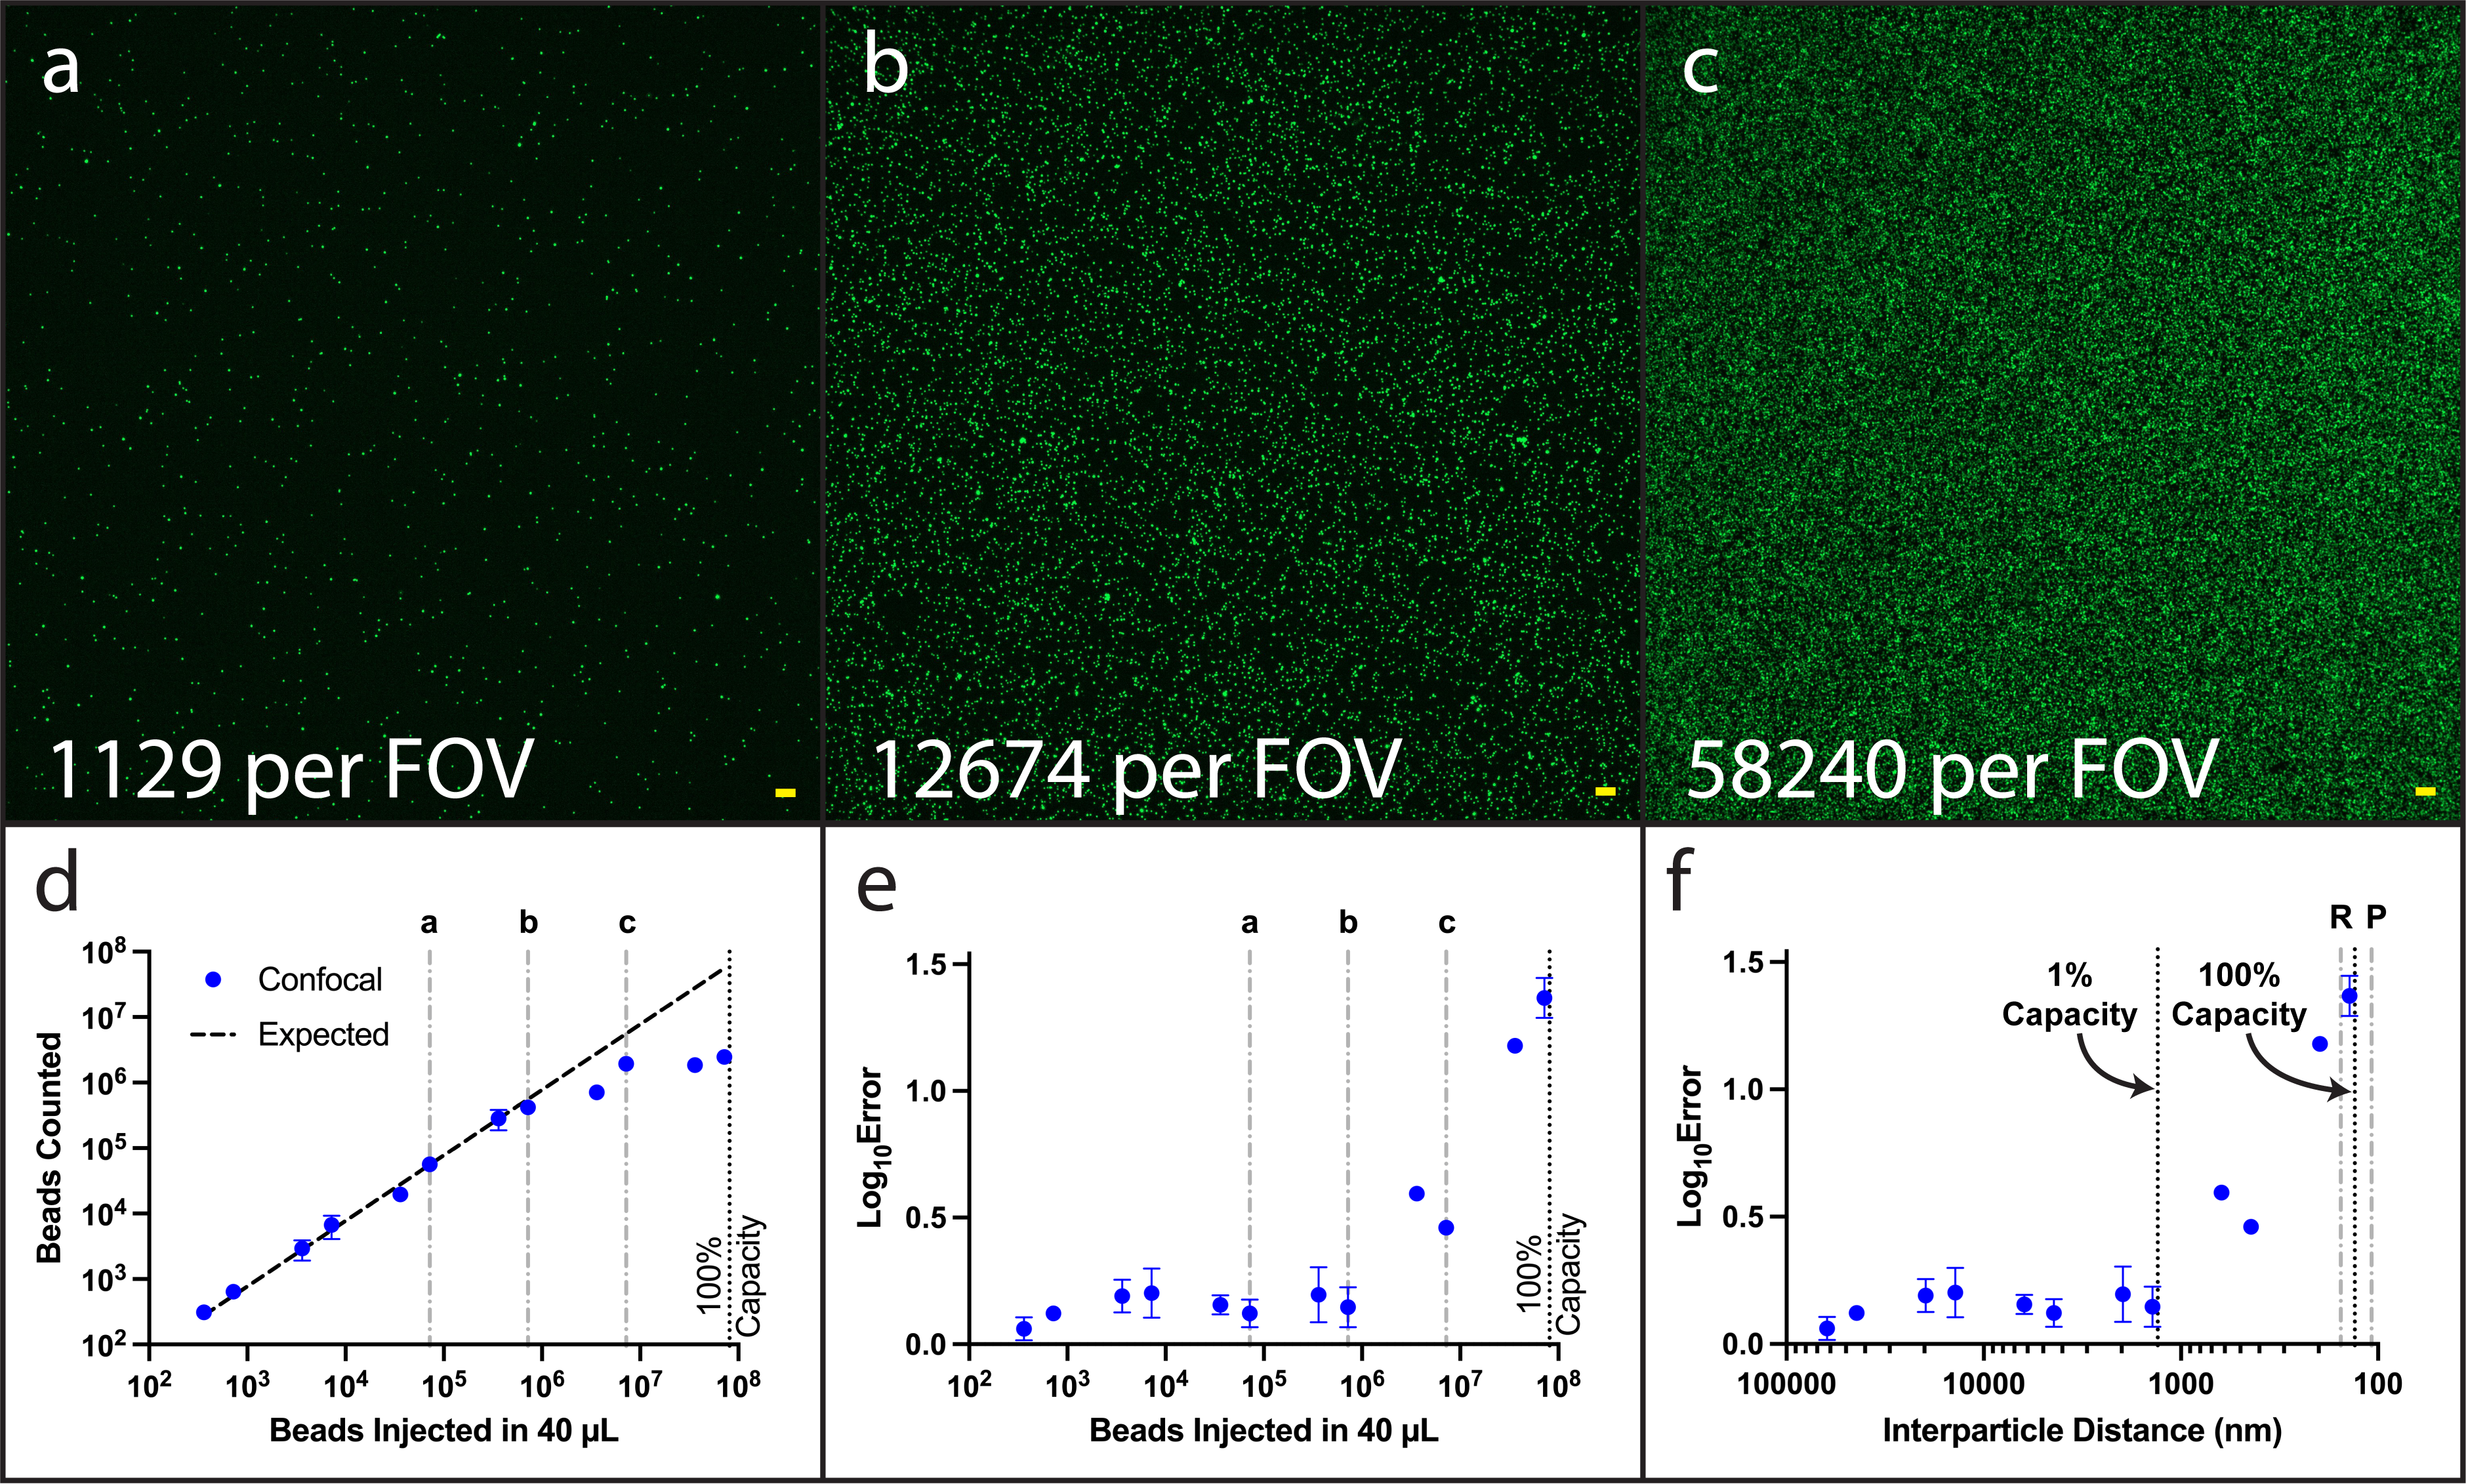
It appears that we are able to accurately quantify nanoparticle inputs over a range of ~102 – 106 (Figure 2d). Beyond inputs of 106 the CAD-LB incurs considerable error as the captured count falls short of the theoretical input. This can best be explained by visualizing the scenario depicted in Figure 2c; at higher inputs nanoparticle crowding occurs which decreases our ability to individually resolve nanoparticles. In terms of log10 error, the CAD-LB faithfully represents the order of magnitude of nanoparticle inputs over the range of ~102 – 106 (Figure 2e). Considering the theoretical average interparticle distance following capture, error greater than an order of magnitude is encountered when approaching dimensions associated with the optical resolution of the imaging system (Line R in Figure 2f) and the size of camera pixels (Line P in Figure 2f). A valuable finding is that the upper limit of the CAD-LB dynamic range is reached at ~1% membrane capacity, that is, the input count is 1% of the total pore count (~107).
It is important to note that there is a discrepancy between the theoretical input of nanoparticles and the captured count. The expected count was reduced after observing a systematic error spanning the linear region of the counting curve; the CAD-LB reported inputs that were consistently lower (~22.5%) relative to the theoretical input. To ensure that nanoparticles were not being lost post-capture we performed live imaging experiments, one of which can be viewed in the video below:
It is difficult to focus on the membrane during live capture due to the membrane bowing under pressure. At approximately second 12 of the video the membrane goes out of focus again, however, this movement is associated with the pressure being released as the pipette tip was ejected. After examining the frames immediately before and after the pressure was released, it is clear that virtually all captured nanoparticles are retained (Figure 3).

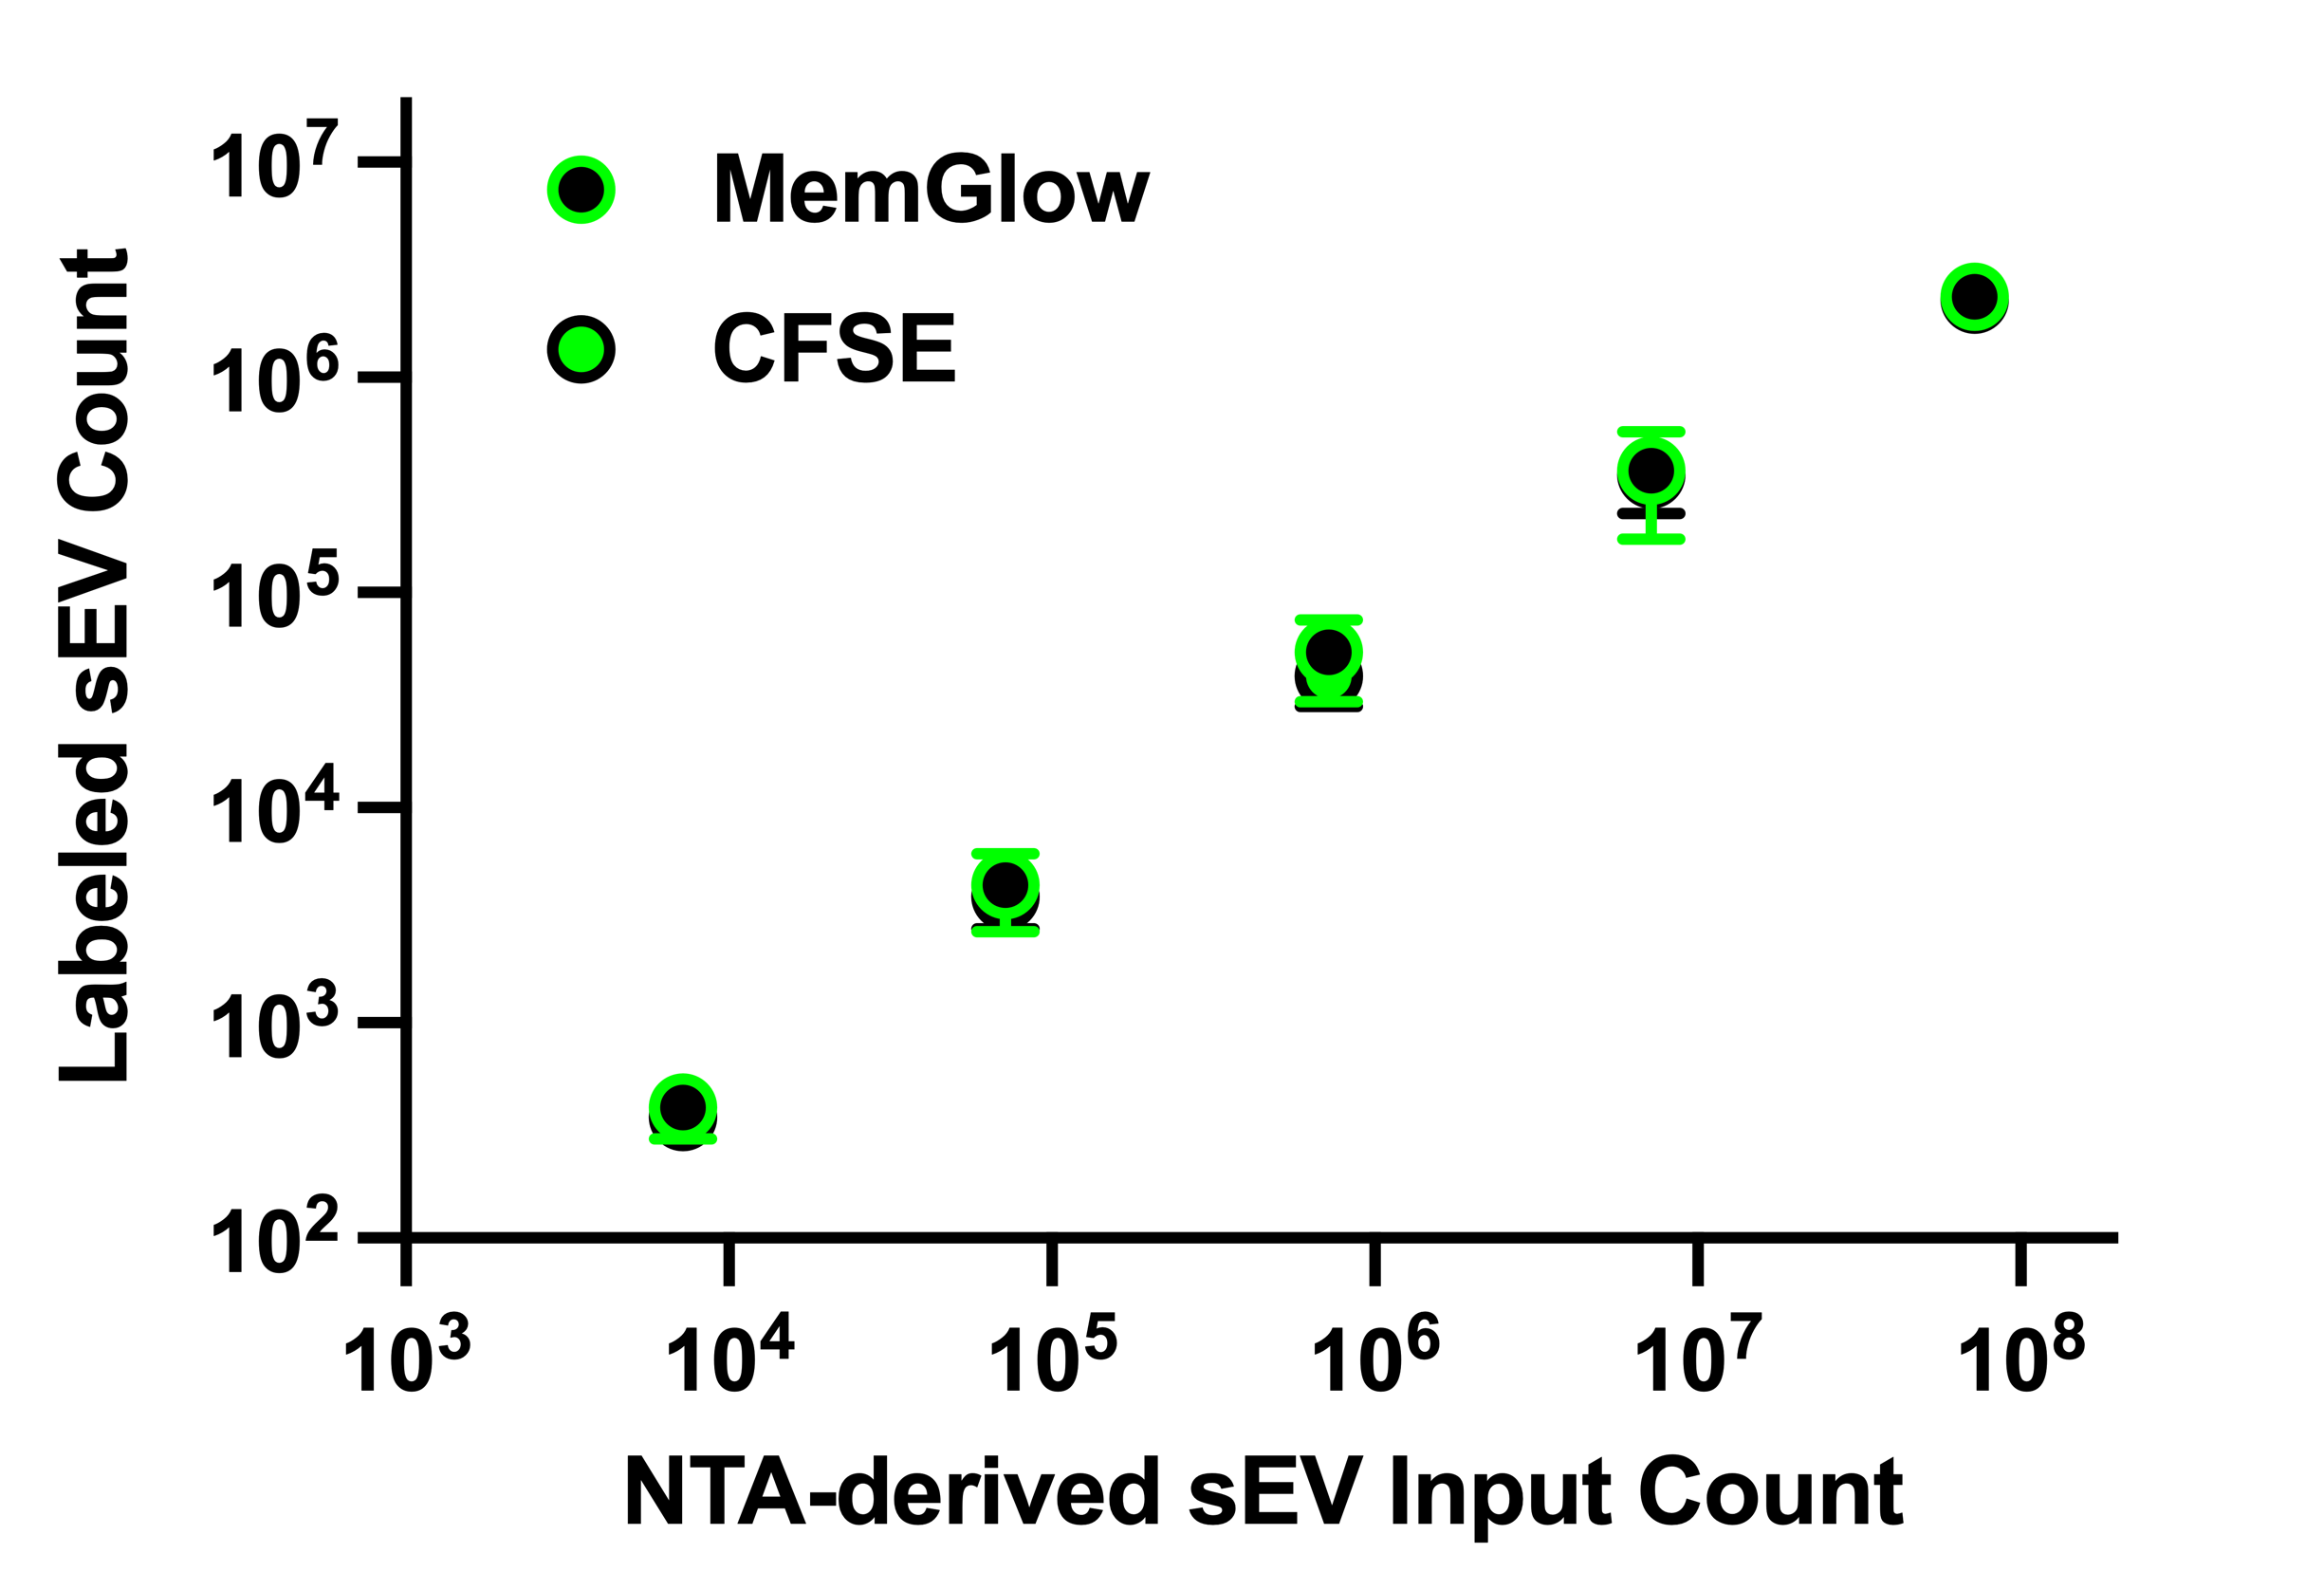
Quantification of these images confirms this as nearly identical counts are returned from both images. The abovementioned discrepancy could therefore be a result of the manufacturer’s over-estimation of nanoparticle concentration, loss associated with sample preparation or device dead volume, or some combination thereof. Following this, similar experiments were completed using purified sEVs collected from primary bladder epithelial (PBE) cell conditioned cell culture media. sEVs labeled with either CFSE or MemGlow were prepared at various inputs and captured and quantified as before (Figure 4).
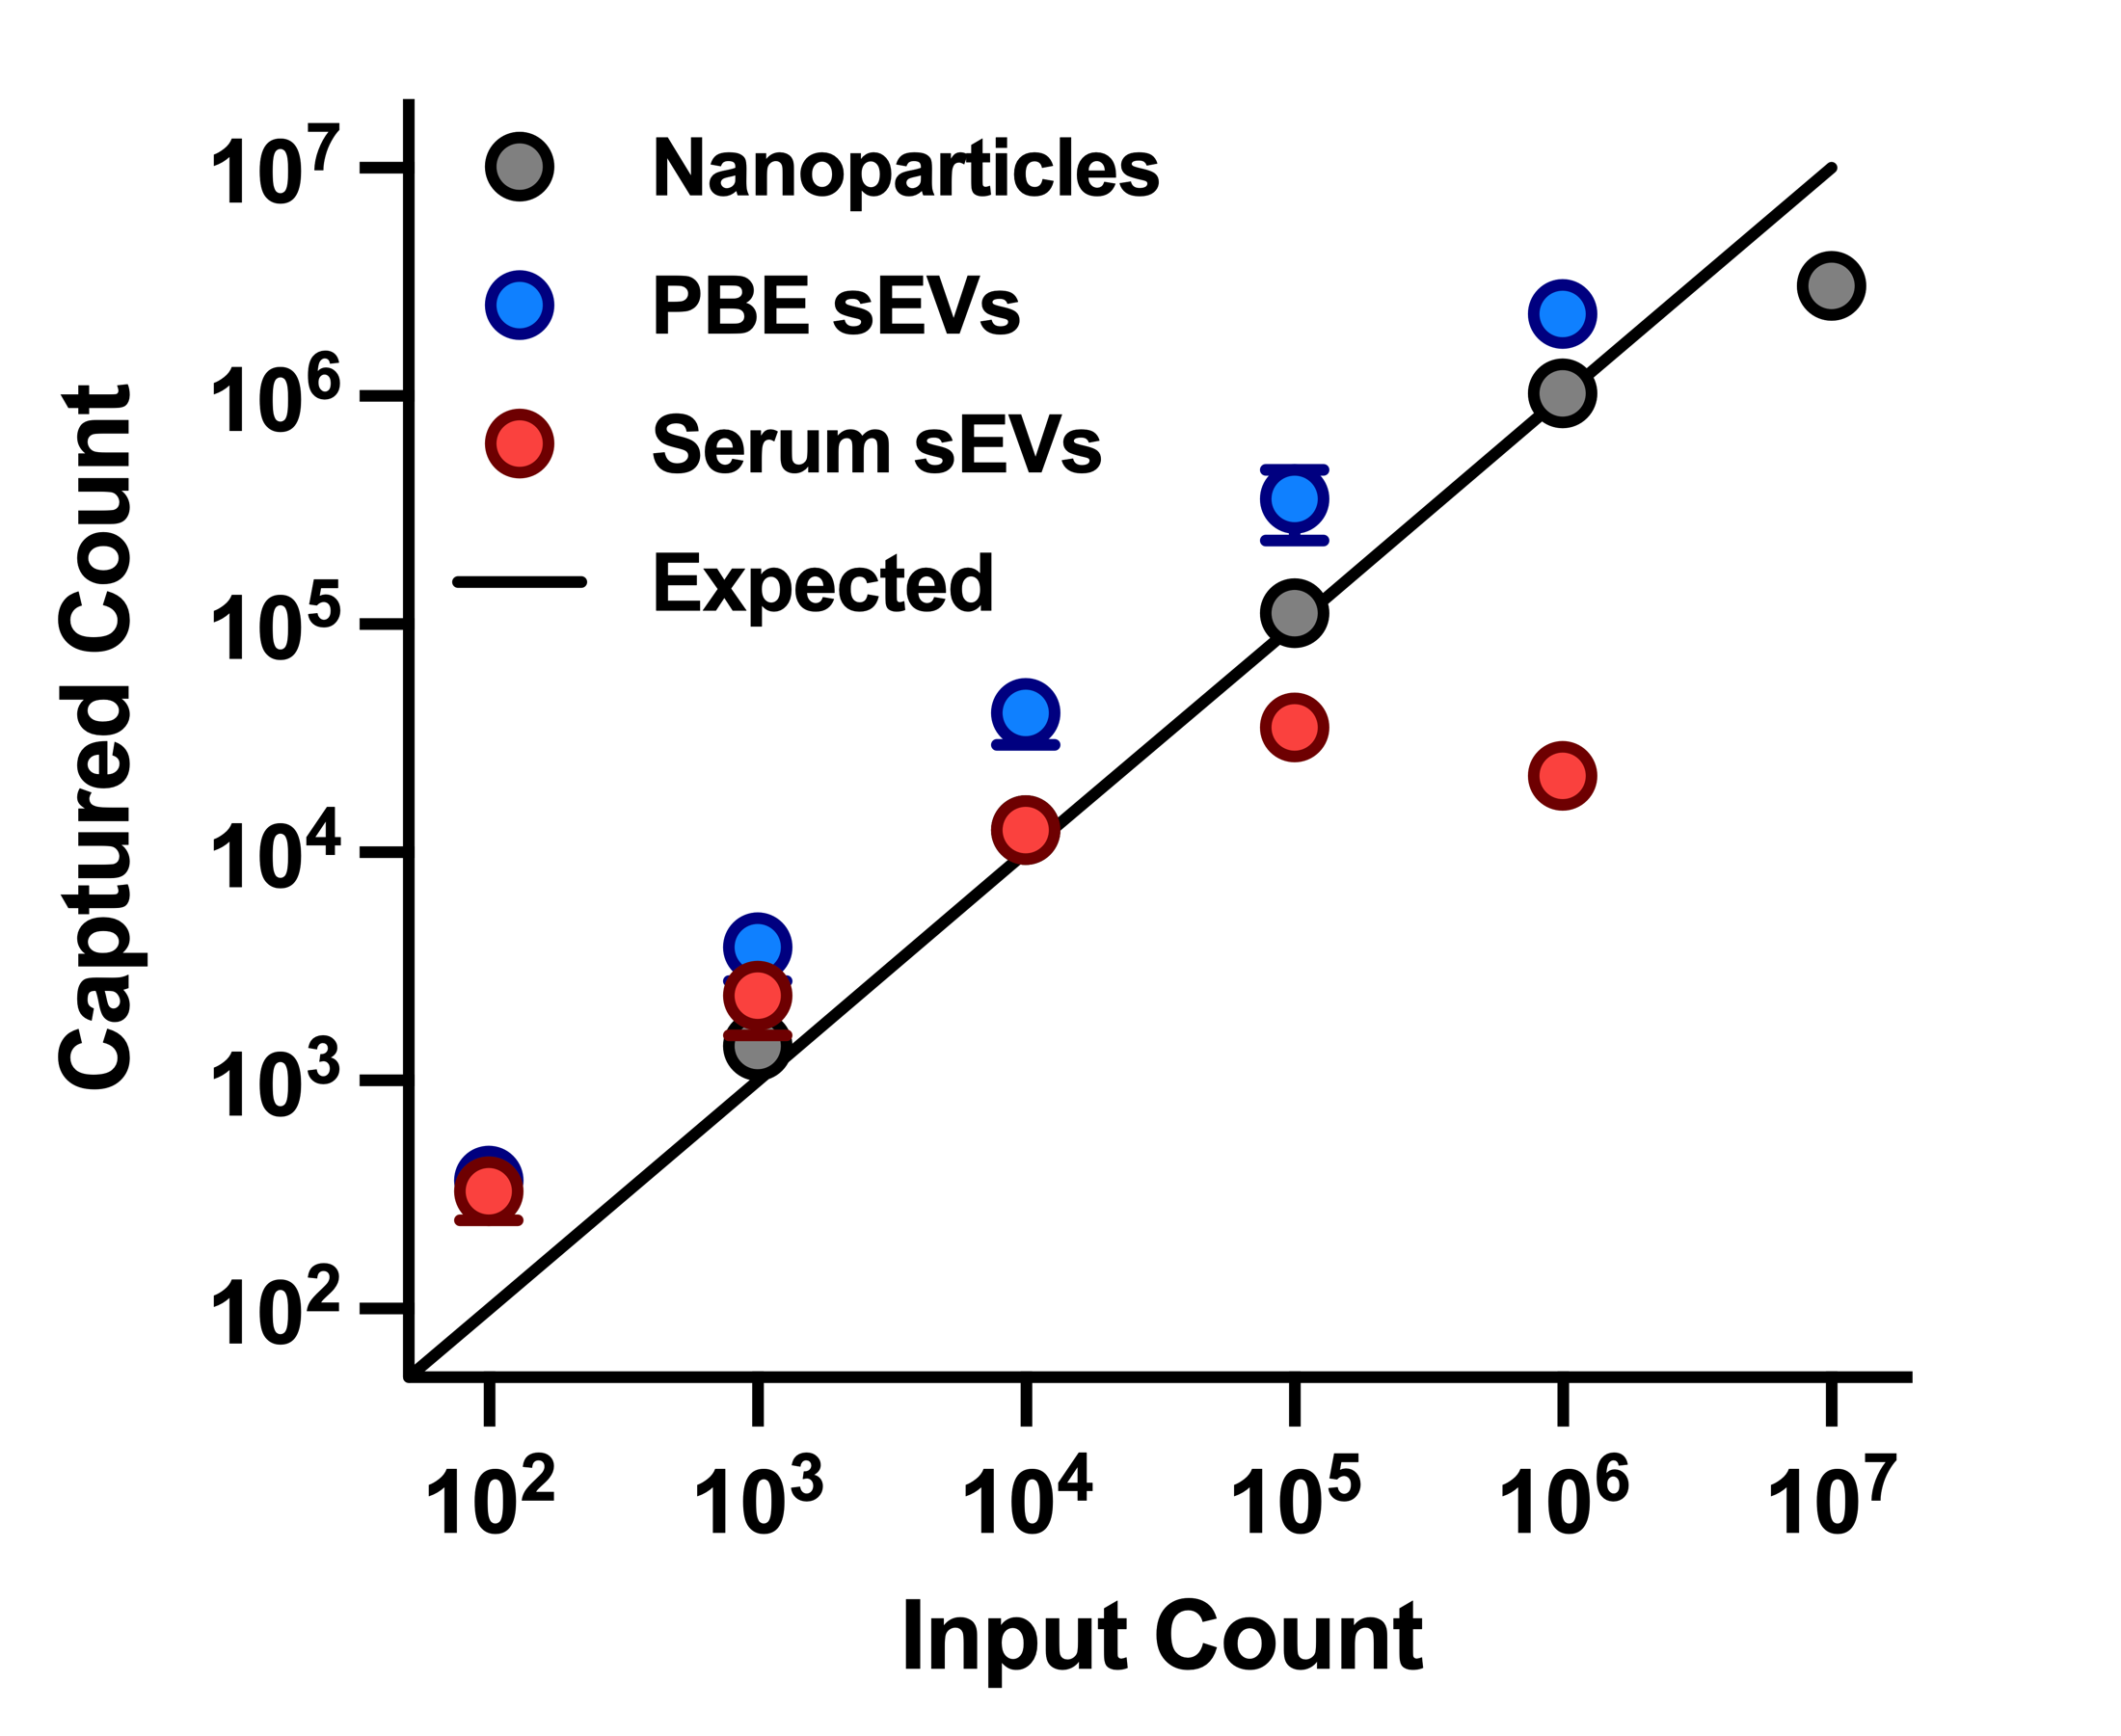
Finally, counting curves were completed with sEVs collected from serum and plotted alongside the previously reported counting curves (Figure 5).
In summary, we have taken steps to characterize the CAD-LB assay defining aspects including capture efficiency and dynamic range using various types of solutions. The next steps will include colocalization controls which will begin to assess the diagnostic capabilities of the CAD-LB, specifically probing its sensitivity and specificity.