BSA-DDM Complex Intensity
I took a look back through the Melvern data I collected, particularly focusing on changes in the intensity data in the BSA-DDM solution (the previously posted plots were of number data). When I compared the peak intensities for BSA, DDM, and DDM-BSA complex I noticed that the intensity peaks fall over the same size distribution but they reach a different peak intensity value.
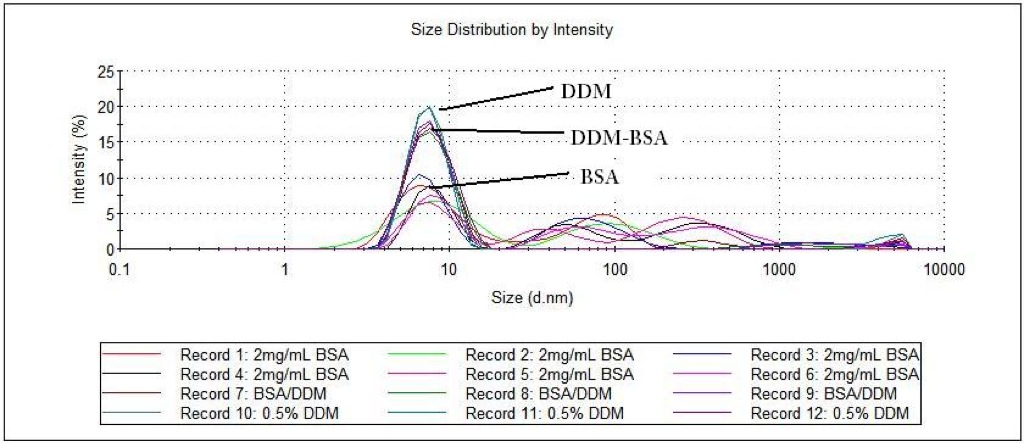
The above figure shows the size distribution data in terms of intensity for all the DDM, BSA, and DDM-BSA sizing that I performed during yesterdays experiment. The reason for the additional peaks in the BSA samples is most likely due to aggregation as it is in DI-water. I talked with Jess and she is going to help me try and get rid of these.
If we were to look at each solutions (DDM, BSA, DDM-BSA) intensity plot and calculate an average peak value we would get the following:
| Solution | Average Intensity Peak (% + SD) |
| BSA | 8.17 + 1.5 |
| DDM | 18.93 + 0.8 |
| DDM-BSA | 17.37 + 1.8 |
Using these values I choose associated test runs with similar values and plotted them on each other to clarify the intensity plot as shown below.
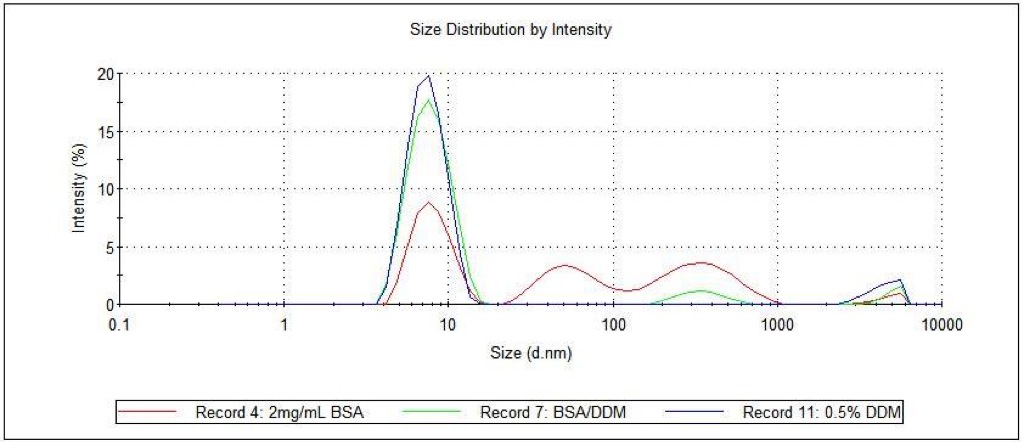
From the above plot it can be seen that the peaks all fall over the same relative size distribution but they reach different magnitudes of intensity. The BSA is the lowest intensity and the DDM is the highest. Factoring in deviations between test runs it is difficult to say whether the DDM and DDM-BSA intensity peaks are statistically different. Coupling these results with the size distribution peaks I was wondering if it is possible that very low quantities of DDM are interacting with the BSA, not enough to make a significant change in particle size, but causing a change in how the light scatterers when it hits these complexes. It is also possible that in the DDM-BSA solution the concentration of DDM is much greater then that of the BSA causing the intensity to be skewed towards the DDM. I would appreciate any input on the matter. Tomorrow I am planning on testing size on a solution of DDM-BSA that a made this morning and allowed to sit for ~24 hours.
Do you expect that the DDM micelles and BSA would be so close in size? It seems like looking for a size change in one species with a substantial population of a second species of similar size in the solution is going to be very difficult. Can you go below the micelle concentration?