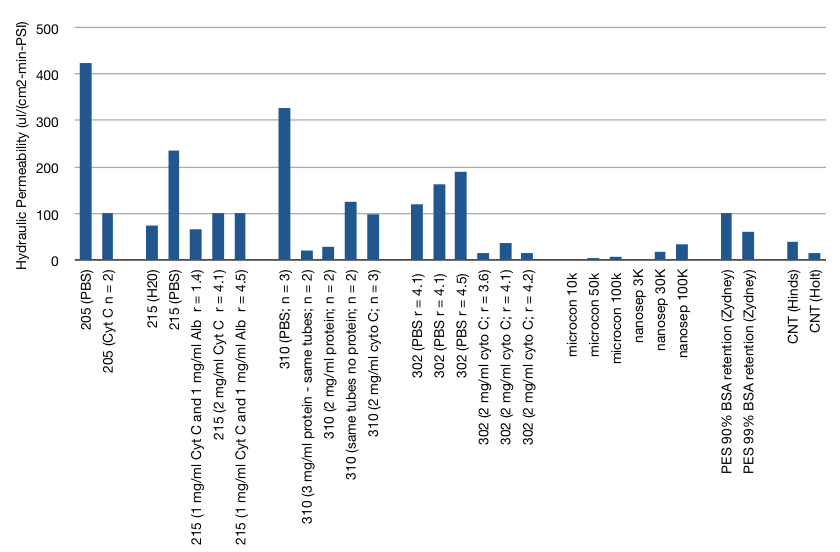
Updated Hydraulic Permeability Plot
Here is a look at all our water permeability through nanomembranes to-date. There appears to be subtle trends showing increasing permeability with radial position (r – values) and a not-so-subtle trend showing decreasing flow with protein (cyt and albumin). Note that with the more recent membranes we’ve been able to do repeats. The permeabilities are high compared to PES membranes and CNT membranes, but our pores are considerably bigger, so we are not doing apples-to-apples comparisons just yet. Click on the picture to read the data labels!