Pore Processing
Here is the current method that I am following to find the pore statistics:
1. Select the highest threshold that you can still close with disk of 3
2. Hit majority
3. Close w/ 3
4. — Try open w/ 3
5. Erode w/ 3
6. Dilate w/2
7. Dilate w/ 2
8. Erode w/ 1
9. Update results using px/nm calibration
10. Remove pores lower than 5 nm
What some of these operations mean:
Close – This will fill in areas that are surrounded by white i.e. close in the pores. One problem with this is that sometimes you can make the smaller noisy “pores” coalesce, especially if you close an area larger than 3.
Majority – Used to get rid of speckly noise.
Open – Can get rid of white areas surrounded by black. Will remove some small “pores” and disconnect joined “pores.”
Erode – Shrinks white area. By shrinking all “pores” this can eliminate some of the smallest ones.
Dilate – Grows white area. Used to bring the pores back to their original size.
Remove pores – Can cut off pores smaller than a specific size. While 5nm is arbitrary, it seems like a good choice thus far.
Specific cases presented:
w612 – The problem I have with this specific wafer is determining which of the background things are or are not pores, since by eye they all look very good to me. The opening does not change porosity, but the cutoff does. Pore removal gets rid of about 1300 pores.
w612, No Open, No Cutoff (Thresh 58) – Porosity .0571
w612, No Open, 5nm Cutoff – Porosity .0401
w612, Open, No Cutoff – Porosity .0571
w612, Open, 5nm Cutoff – Porosity .0401
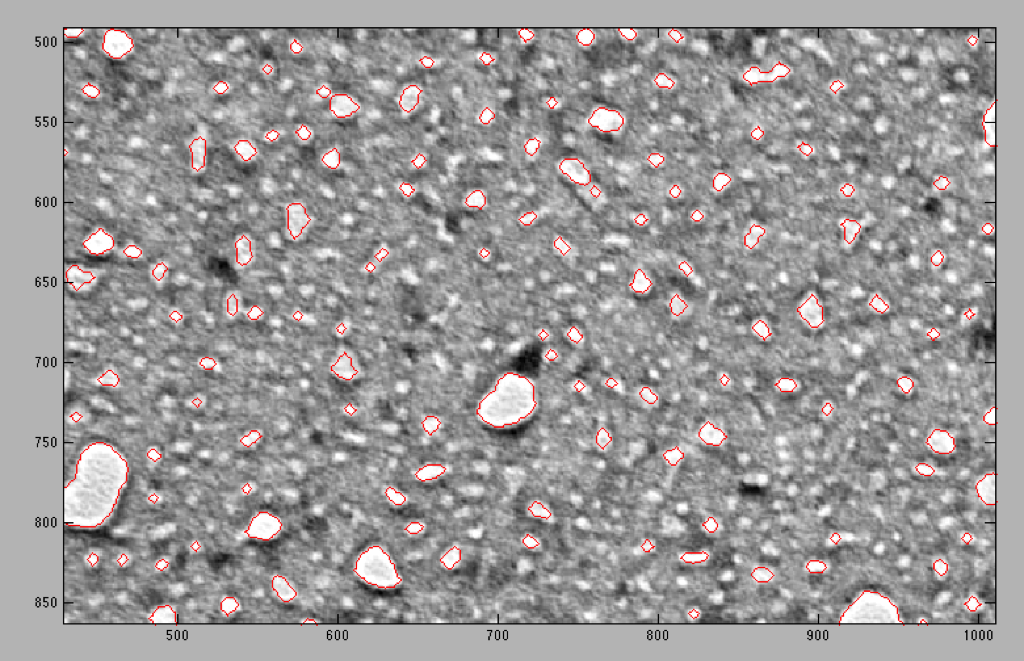
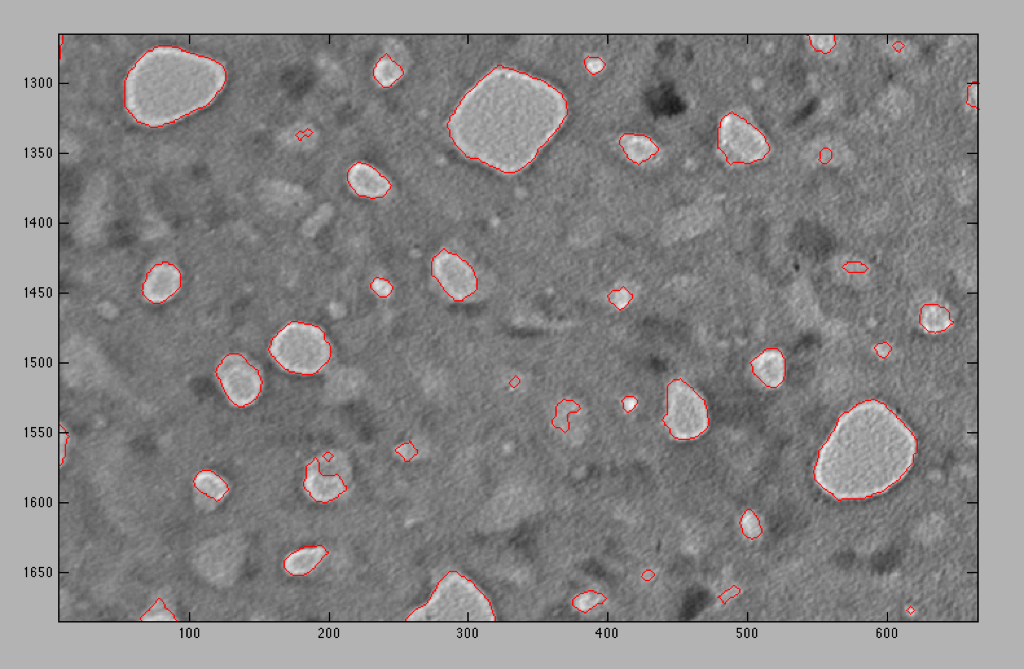
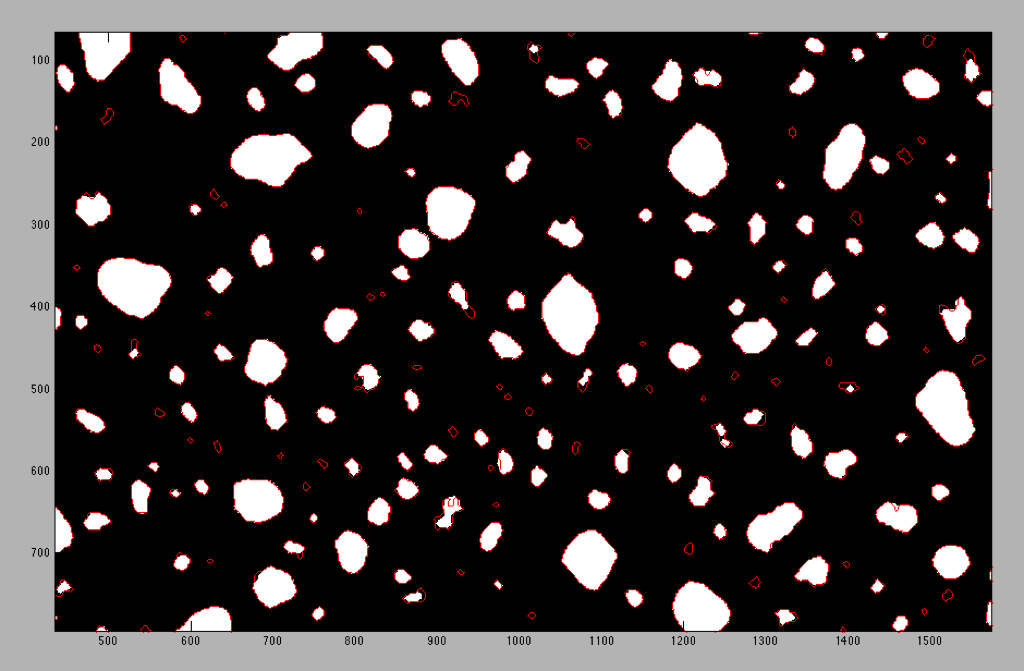
w415 – The difference between pores and non-pores is a little more noticeable, but there still seems to be some overlap. You can see some odd shaped pores or what look to be half pores that are too large to be taken out by the cutoff. The threshold is the largest we can get without losing the insides of the big pores. Removing small pores has less of an effect in this case; only 137 pores were removed and porosity barely changed.
w415, No Open, No Cutoff – Porosity .0927 (Thresh 28)
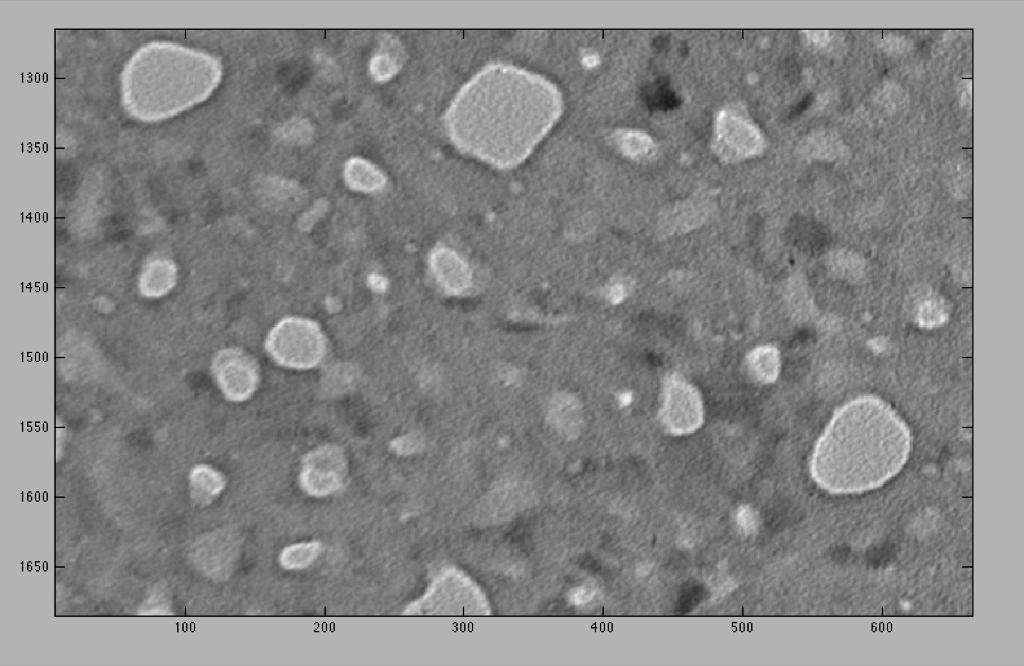
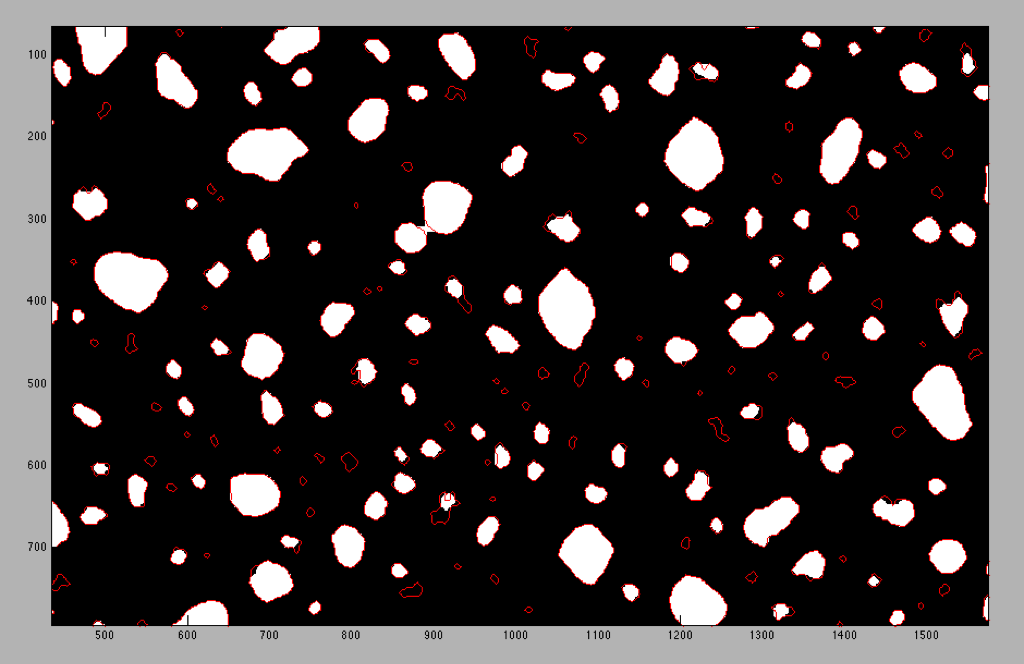
Same image, no red lines so you can see the difference between pores and non-pores
w415, No Open, 5nm Cutoff – Porosity .0915
Note: porosities here are lower than what I was originally getting. We’ll have to see if this new method changes the results I was getting earlier on. At any rate this method is very consistent.
Using a higher threshold and larger close and open structures to compensate:
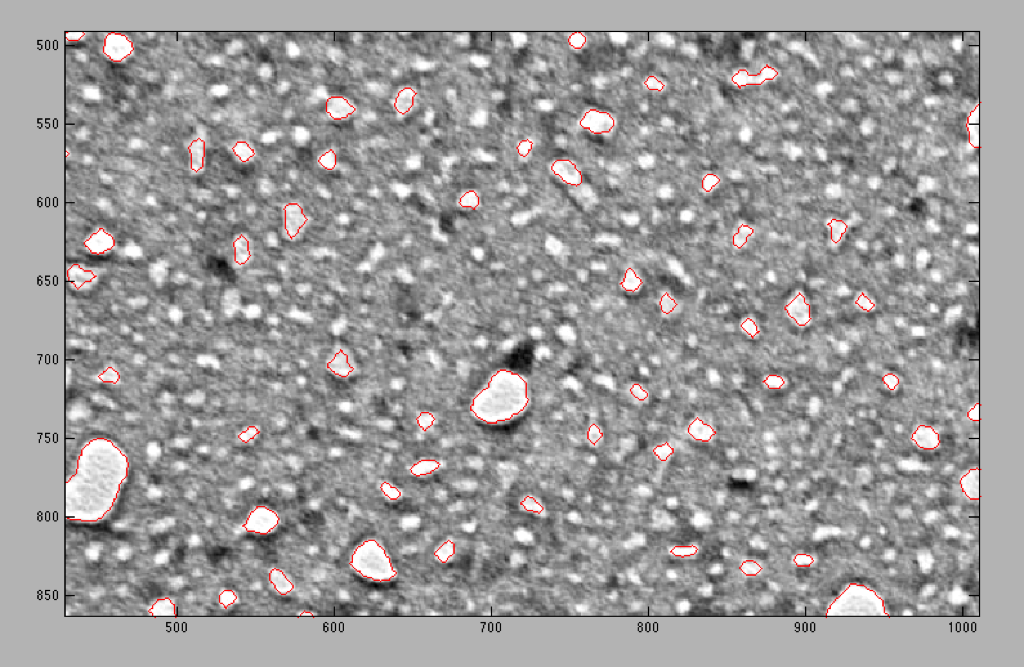
w415, Thresh 28, Close 3, Open 3 (normal method – the following pictures will have the red lines from this image as comparison)
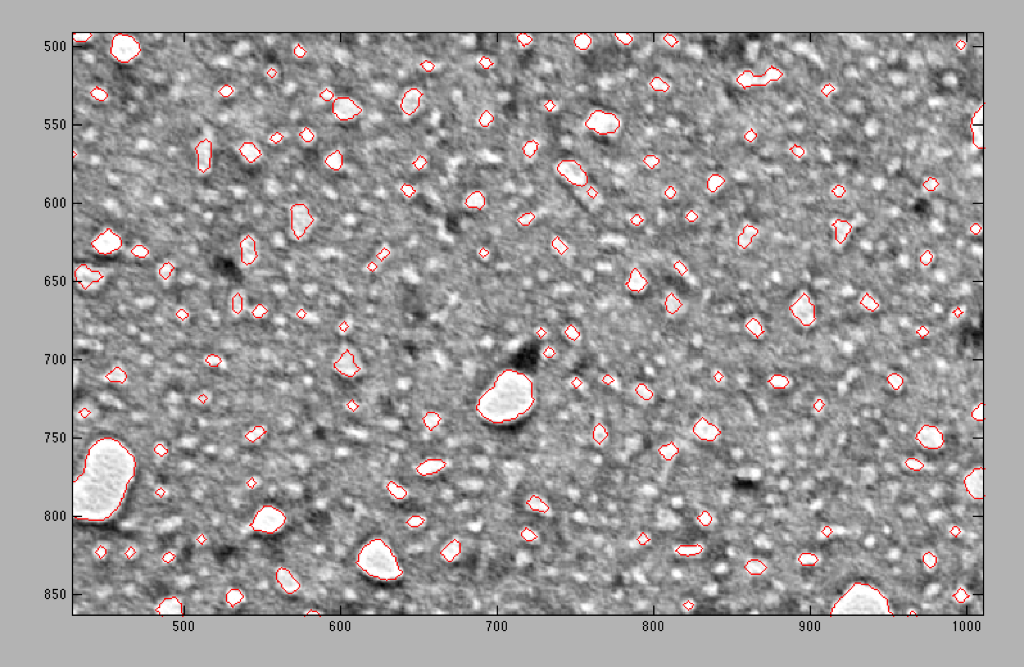
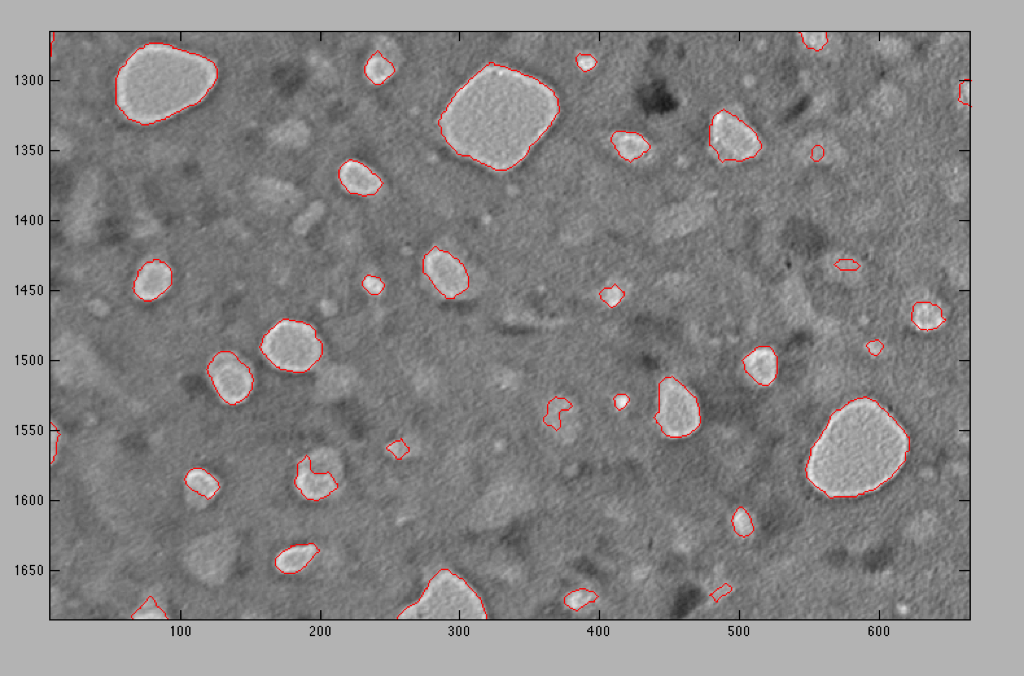
w415, Thresh 30, Close 5, Open 5 – Less small pores and weird pores are smaller. Big pores look normal.
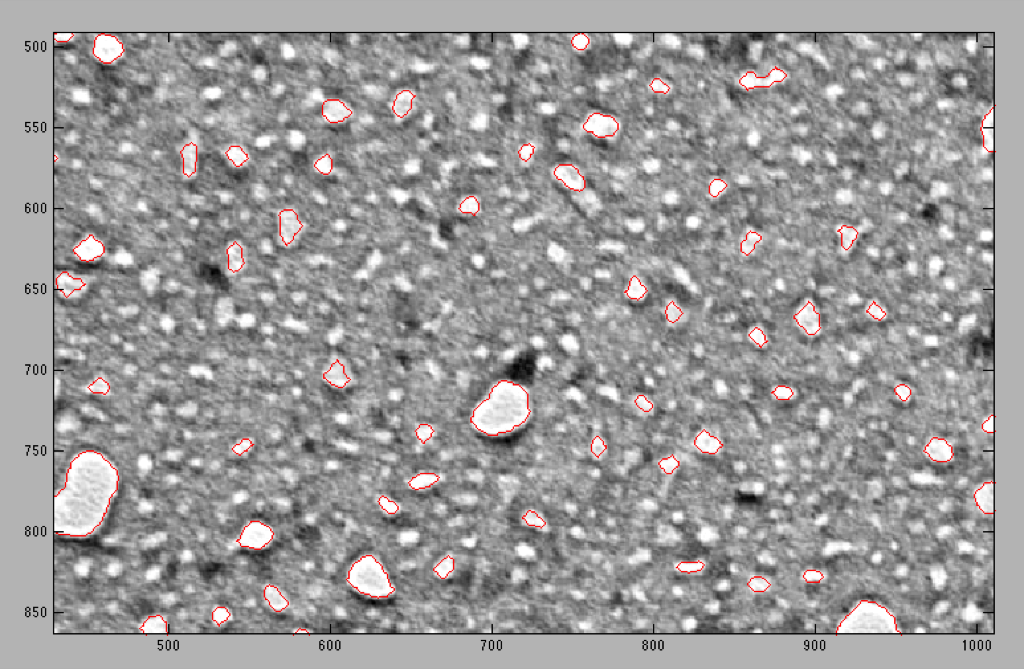
w415, Thresh 32, Close 6, Open 6 – Fewer small pores and weird pores smoothed out. Two of the large pores in the center have become joined because of the large close structure. I don’t think this is an improvement on the previous trial.
On removing pores at the edges:
Apparently Karl, and maybe some other people, used to remove any pore that was cut off on the edges of the images. I don’t think that this is a good idea. Any pore you remove cuts down on the total image porosity since now you just have empty areas where pores used to be. I agree that you will skew down the diameter statistics since the removed pores obviously have a much larger diameter than appears in the image, but if we leave them out it’s omitting potential information. I think the best way to handle this is to re-crop your images so that you cut into the least amount of big pores as possible since skewed data from small pores will affect the distribution less.
Pore Removal
Here’s a test to see if pore removal has a big effect. In this set of images, I calculated statistics with the half pores and without half pores. These images were slightly smaller than ones I would normally evaluate to make it easier for me to cut multiple pores in half.
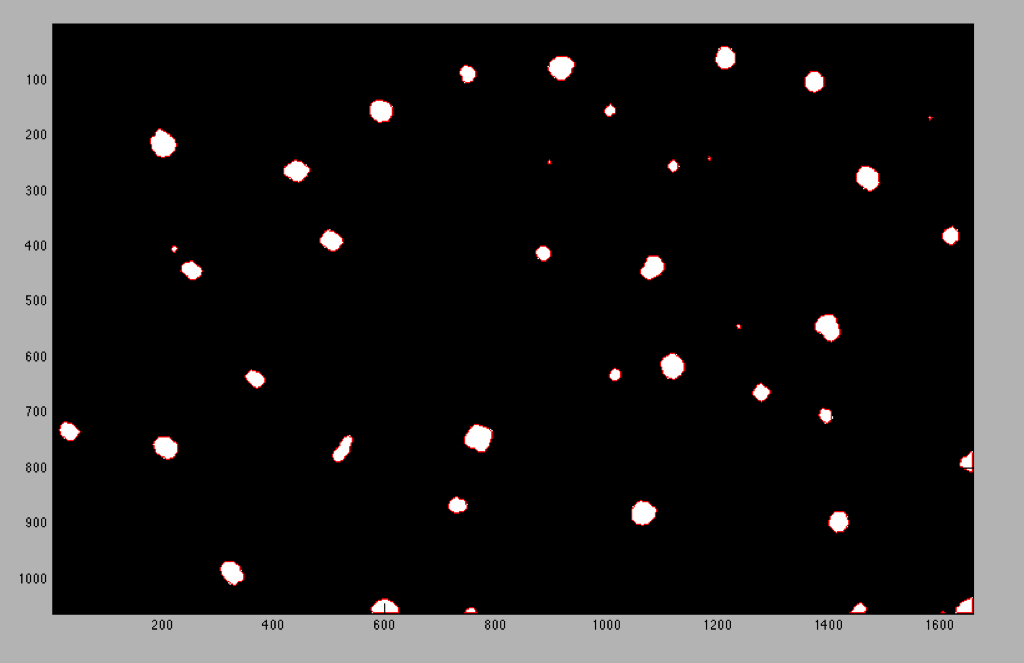
Pores Intact – Porosity 1.94%
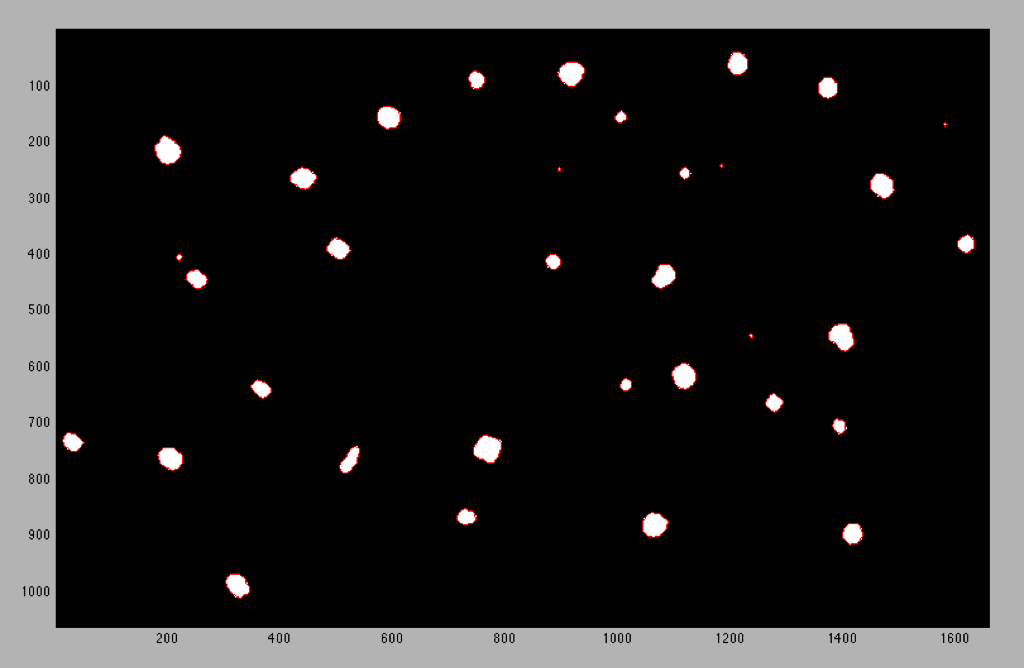
Pores Removed – Porosity 1.78%
Histogram Comparison:
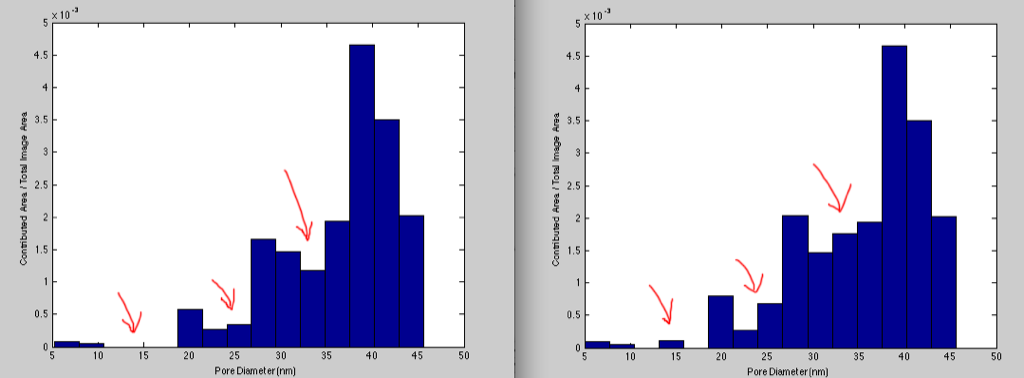
The result is there is a small change in overall porosity and some differences in the histograms. These are however small images in which I deliberately tried to capture this phenomenon. Is this a big enough change to require a better solution to the problem?
Discussion Topics:
How do we define where we cutoff small pores?
Should we try to remove odd shaped pores or change the way thresholding is done or allow this to be part of the error in the process?
How do we define what is a through pore?
What should we do with cut in half pores at image edges?
I’ll have more to add on this too as I make my way through the processing process, so please add comments as I go!
On removing edge pores: I am working on a version of Pore Image Processor which treats edge pores properly (i.e. includes them in porosity calc, but drops them from other calcs such as average pore diameter, etc.). This necessitated rewriting how I stored pore data internally to the application, so it’s taken a little while, but I’m close to having the issues resolved, and if this would be a benefit now, I can get it out the door as quickly as possible.
Jess, your suggestion of recropping the images to not cut through big pores could end up skewing the data a different way, since you are actively selecting the cropping box based on features of the wafer.
A few questions from someone who is pretty much an outsider…
Why should ‘small’ pores be removed?
Why should ‘real’ pores be round?
What are you referring to when you say half pores?
Why should small pores be removed?
This comes down to an aspect ratio problem. Since the membrane is 15nm thick, it is improbable that pores with diameter 5nm or less go all the way though.
Why should real pores be round?
They don’t necessarily need to be perfectly round, but these weird invaginated shapes that we’re getting in the 5th image for instance are not real pores. They may be slight depressions in the film, but they are not as bright as the actual pores. The thresholding is only grabbing a small piece of them that is lighter than the rest. I think though that we’ve come to agree that real pores are more or less circular.
What are you referring to when you say half pores?
Perhaps it wasn’t very clear, but when I was saying half pores I was referring to the pores that were cut by the edges of the image.
The larger the image, the less it should matter if we include or exclude edge pores. The porosity estimate will be more accurate if they are left in, but the average pore size will be a touch underestimated. Based on your comparison and only 0.16% difference in porosity, I say leave them in for convenience and consistency between users. Keeping in mind that we are only looking at part of the membrane, we likely have this much uncertainly in our estimate of the porosity anyway.
Jess, Nakul and I were discussing this the other day. There is an interface where the floating membrane “hits” the silicon support and becomes supported membrane. Both floating and supported membrane are porous, so couldn’t there be half pores at this interface? Then the calculations based on the TEM in PIP wouldn’t introduce artifacts(if the half pores are kept in the calculations). I think.
Two things about pores at the membrane edge:
1) Based on Jim’s correct argument, the larger the image, the less important the edge pores to porosity and pore size. The entire membrane is probably 100,000 times larger than most of the images that you process, so the membrane edge is not significant.
2) You can’t really have a blocked pore at the edge, at least not the type of blockage that you are thinking about. this is because the membrane actually sits on an SiO2 layer that is partially dissolved when the protective oxide is removed. The effect of this is that the edge of the membrane support never covers half the pore, as this blockage would have been dissolved. However, it is possible for a pore directly over the wafer (but next to the edge) to enable the formation of a cavity in the SiO2 layer that may connect to the open area in a way that behaves like a blocked pore. Sorry, this is hard to explain in text…
I like the idea that Tom put forth (in conversations) for eliminating closed pores with a cut-off on average intensity inside the pores.
I’m not sure what objective criterion we can use to establish proper cut-offs other than agreement with theory. Unfortunately, this gets a bit circular because we are trying to claim agreement with theory by using pore distributions.
Notice how the material that we generated this past week (670 and 673) is simpler to analyze because the background of ‘closed’ pores isn’t there.
If you want to automatically exclude non-round pores, you obviously need a measure of roundness. Two ideas I had for a roundness index:
1) (Major Axis Length)/(Minor Axis Length). A value of one would mean the best fit ellipse to the pore is actually a circle, greater than one means the pore is elongated. Advantages: Easy to calculate, easy to understand. Disadvantages: Really just a measure of pore elongation, shapes elongated in more than one direction will probably measure ’rounder’ than they might look to your eye.
2) (Pore Area Inside Circle) / (Total Pore Area), where the circle is the circle with the same area as the pore and centered on the pore centroid. If the pore were perfectly round, this index would also be one, if not, some pore area will fall outside the circle, so a value less than one would indicate decreased roundness. Advantages: I think this would do a better job than option one on pores which were misshappen in other ways than simply being elongated in one direction. Disadvantages: This will be much more computationally intensive than option one, and the numerical index is perhaps less intuitive to interpret.
If you guys want to pursue this, I could write something up for either of these cases and see how they do on example pore shapes.
Also, I will get started on adding a function to remove pores based on average pixel intensity.
Mike – Please do start on the average intensity feature. We are discussing this entire post at some length at Tuesday’s meeting and so we should have some more feedback on other ideas like pore shape. We are ready to publish another paper and so this is an attempt to make sure all the data is processed in a uniform way.
The average intensity feature has now been added in the new release of PIP. The results table will now show the average intensity of any selected pore, as well as the mean and standard deviation of the average intensities of all pores. Pores can be selectively removed based on their average intensity using the same control as for size cutoffs in the previous release; I just added intensity to the list of property values you could select and cut off by.
The new release also handles edge pores (pores which are not completely contained within the image) more appropriately. Their area is included in porosity calculations and their intensity is included in mean avg_intensity calculations, but their areas, diameters, and major and minor axes are not included in overall means since these numbers will not be accurate. Edge pores count as 1/2 pore for the pore density calculation. Pores identified as edge pores are outlined in green rather than red when pore boundaries are shown so you can easily see which pores have been identified as edge pores in images.