Discoloration Array 2
This is a repeat of the previous array experiment, but with a higher NaHCO3 concentration (1.85 mg/mL). Also, since these experiments require a lot of samples, I decided to cut chips off of wafer skeletons. This one was w622. As before, these were not RTP’ed and they were placed in the oven at 37C. I used the same salt concentrations (0, 0.1, 0.5, 1 M NaCl) but one more NaHCO3 concentration (0, .23125, .4625, .925, 1.85 mg/mL).
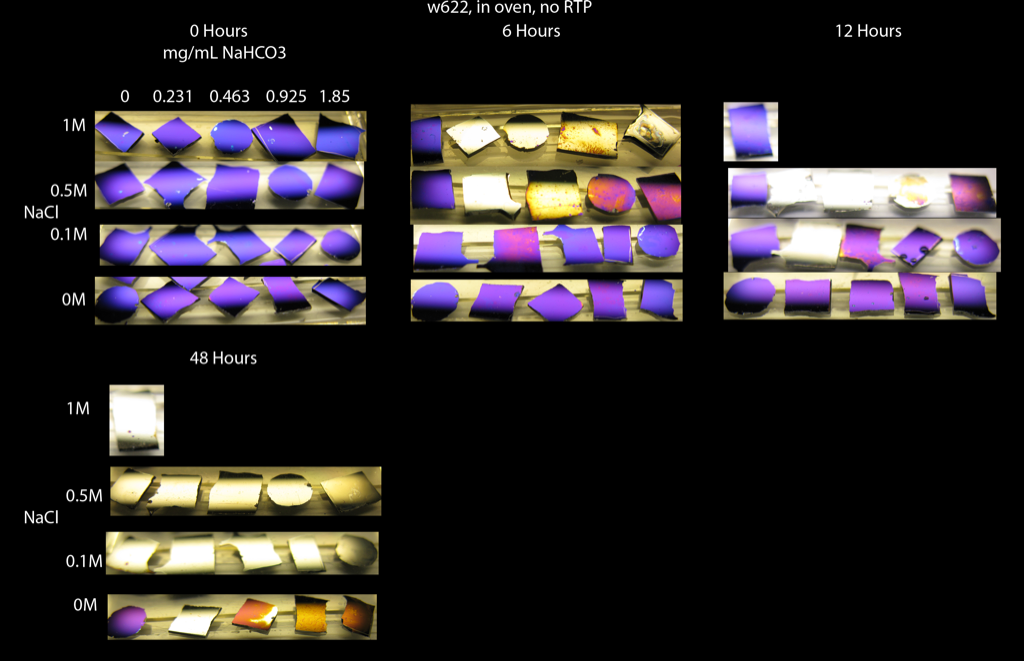
Again, higher NaCl concentrations at a given NaHCO3 concentration caused faster discoloration. Also, lower NaHCO3 concentrations at a given NaCl molarity caused faster discoloration. Everything discolored in ~ 2 days.
I followed the pH this time. At each time point, the pH of salt-free solutions was the highest (NaCl stock had a low pH). The pH’s of all NaHCO3-containing solutions were higher than NaHCO3-free solutions, as expected. If you look carefully, notice that the pH of all of these solutions increased with the time in the oven.
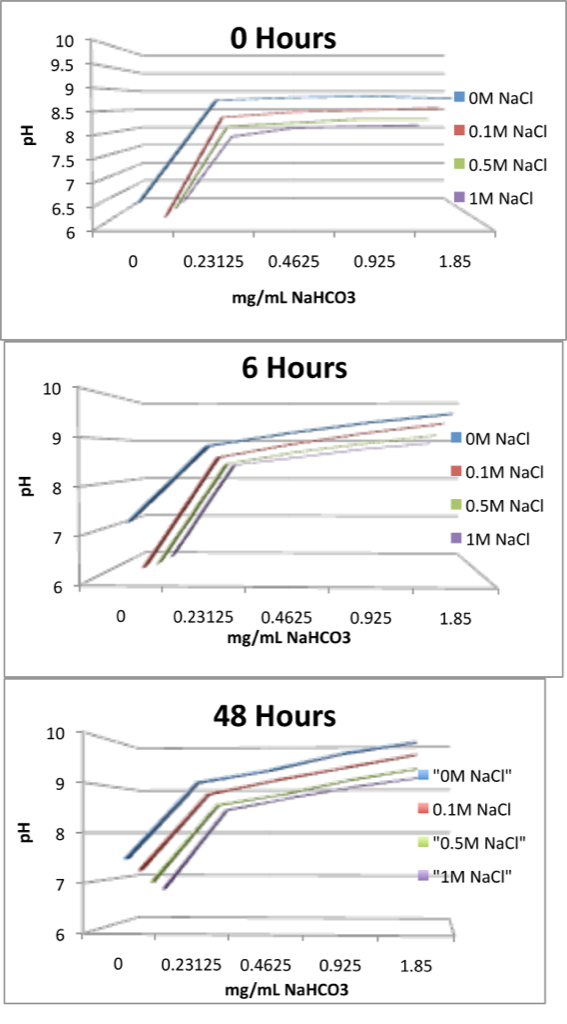
So even though higher NaCl concentrations had lower pH’s at a given NaHCO3 (which a pH hypothesis would suggest slower discoloration), they caused faster discoloration.