AFM analysis of discoloration
To complement the recent study which investigated pore changes during discoloration with TEM, I did AFM on the same samples. These were w673 samples which were incubated in DMEM (-FBS) in the 37C oven. We didn’t use FBS because I thought the serum proteins would have adsorbed to the samples and then made AFM analysis of the surfaces/pores impossible.
AFM analysis went really well – all of these images were acquired entirely in repulsive mode. I only got 3 time points because the surfaces after 150 minutes were either really dirty or really degraded.
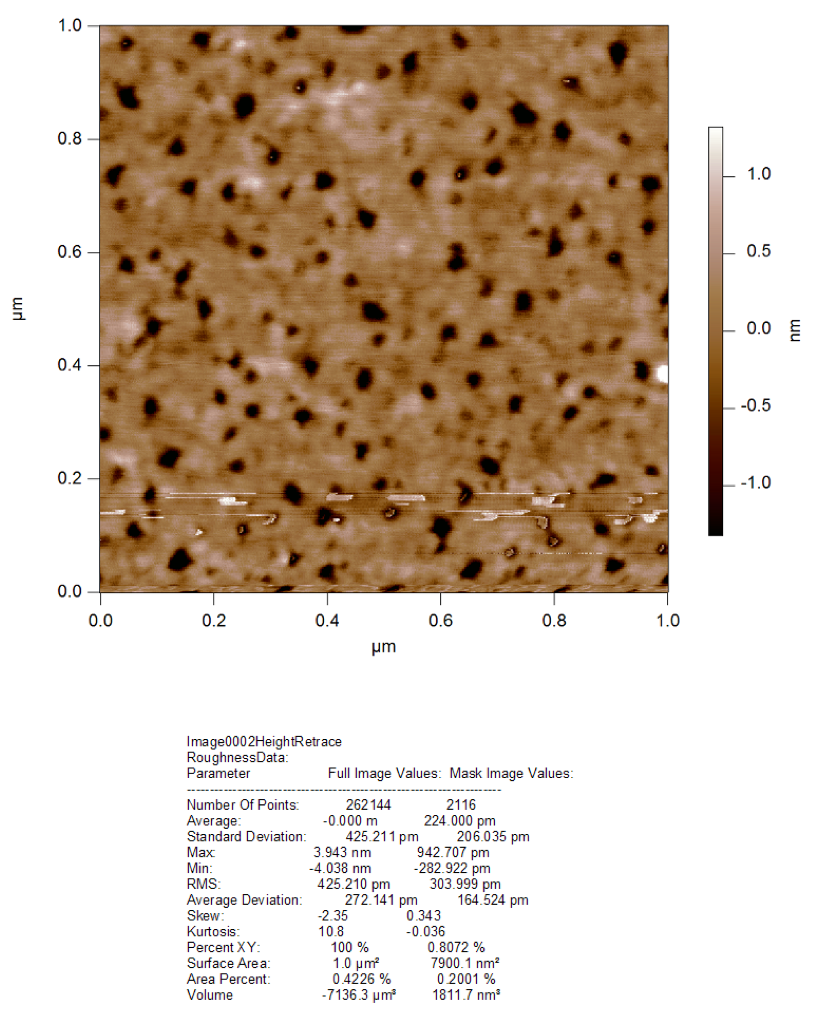
At time = 0, you can see a distribution of pore sizes, with a significant number of very small background pores and larger pres with diameters ~20 nm. After 90 and 150 minutes, the pore diameters increased significantly. Interestingly, the smaller background pores seem to have largely disappeared by 150 minutes. I’m not sure if this was due to sample variability (these were 3 different TEM samples) or if some of the smaller background pores grew into each other to form larger pores.
If you look at the data below the images, you can see that the RMS roughness increased from 0.16nm to 0.22nm to 0.33nm from 0 to 150 minutes. I calculated the roughness on areas of the surface that did not include pores.
Time = 0 minutes
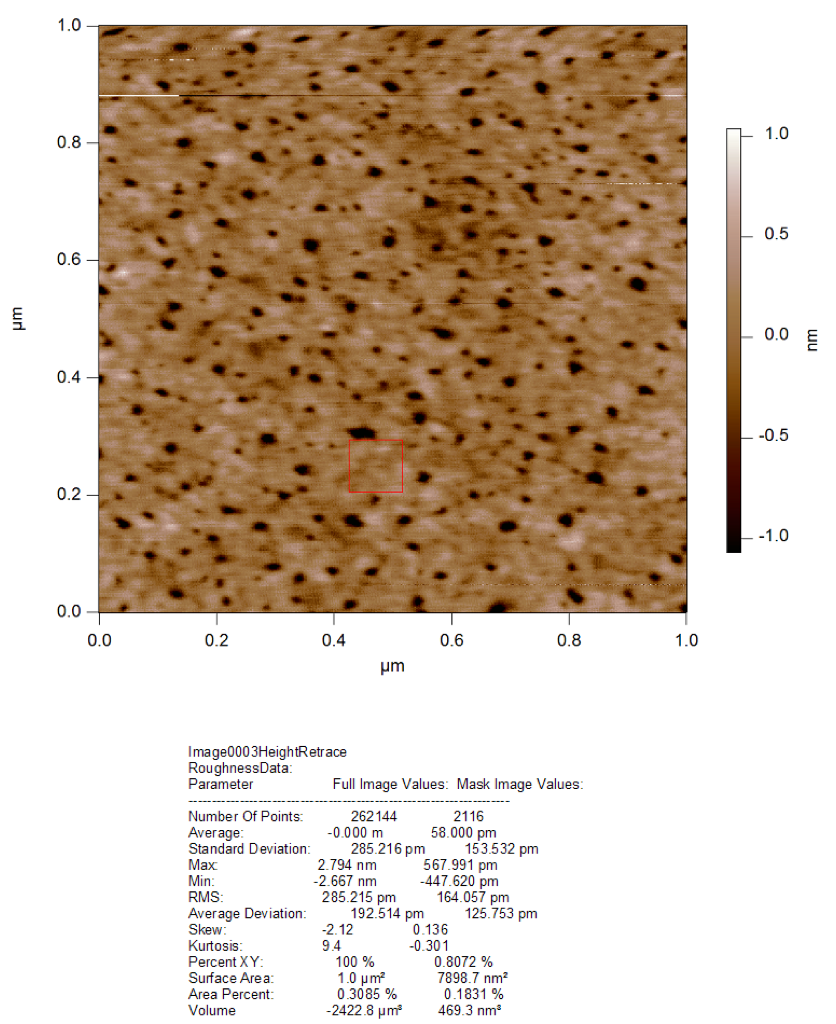
Time = 90 minutes

Time = 150 minutes