AFM-Pore Processing analysis of Discoloration
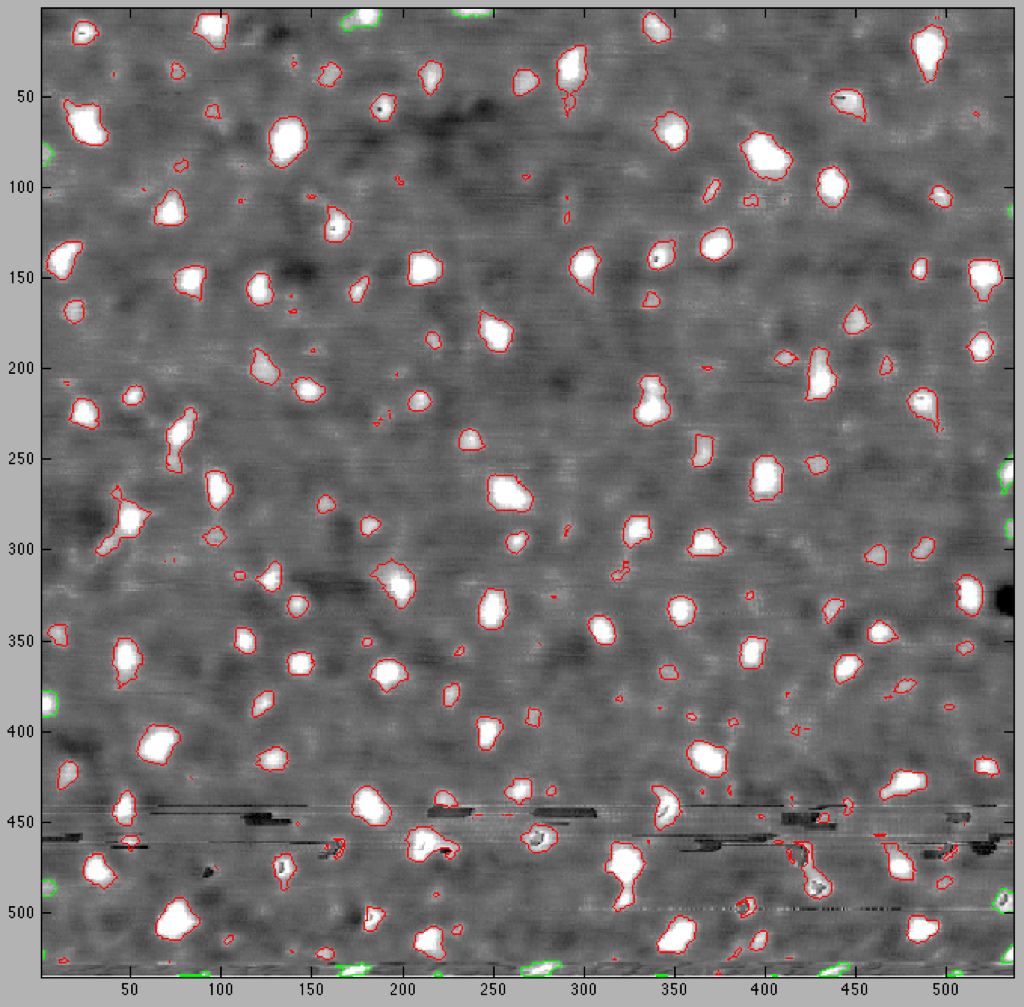
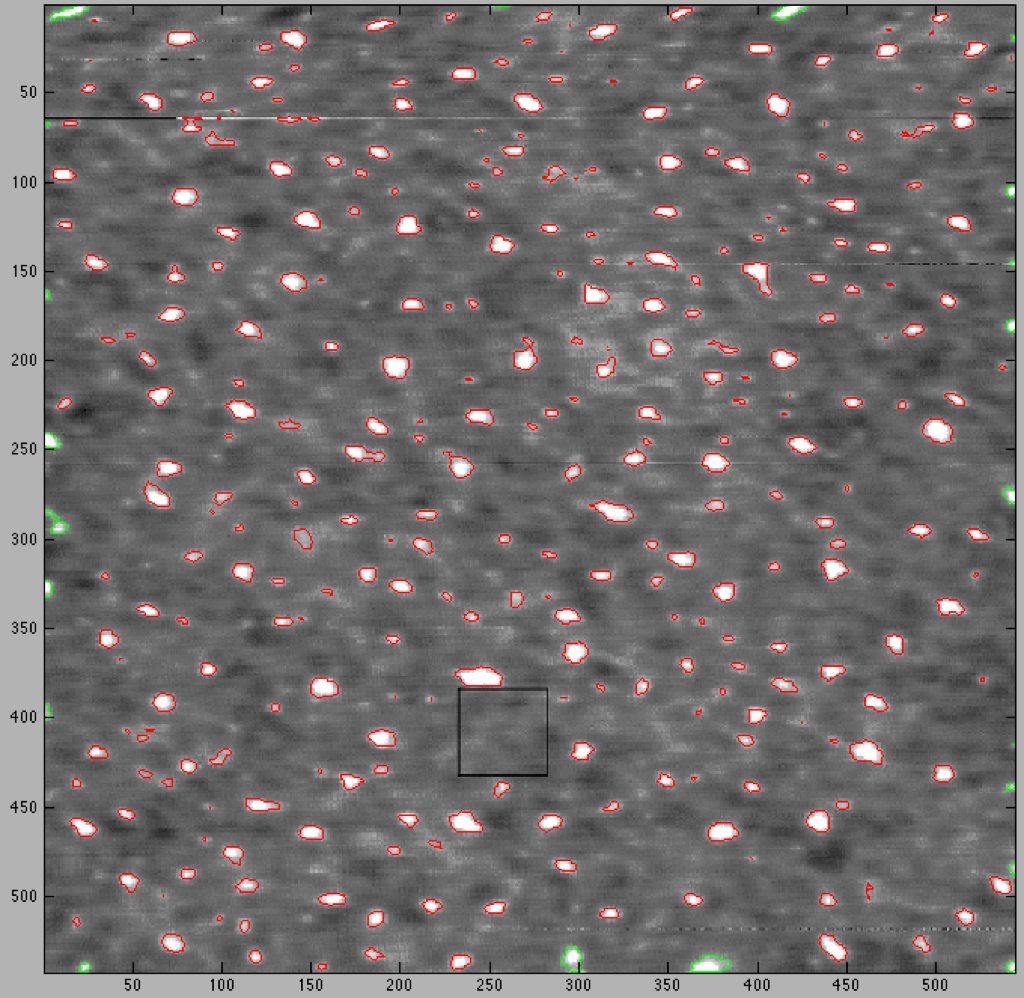
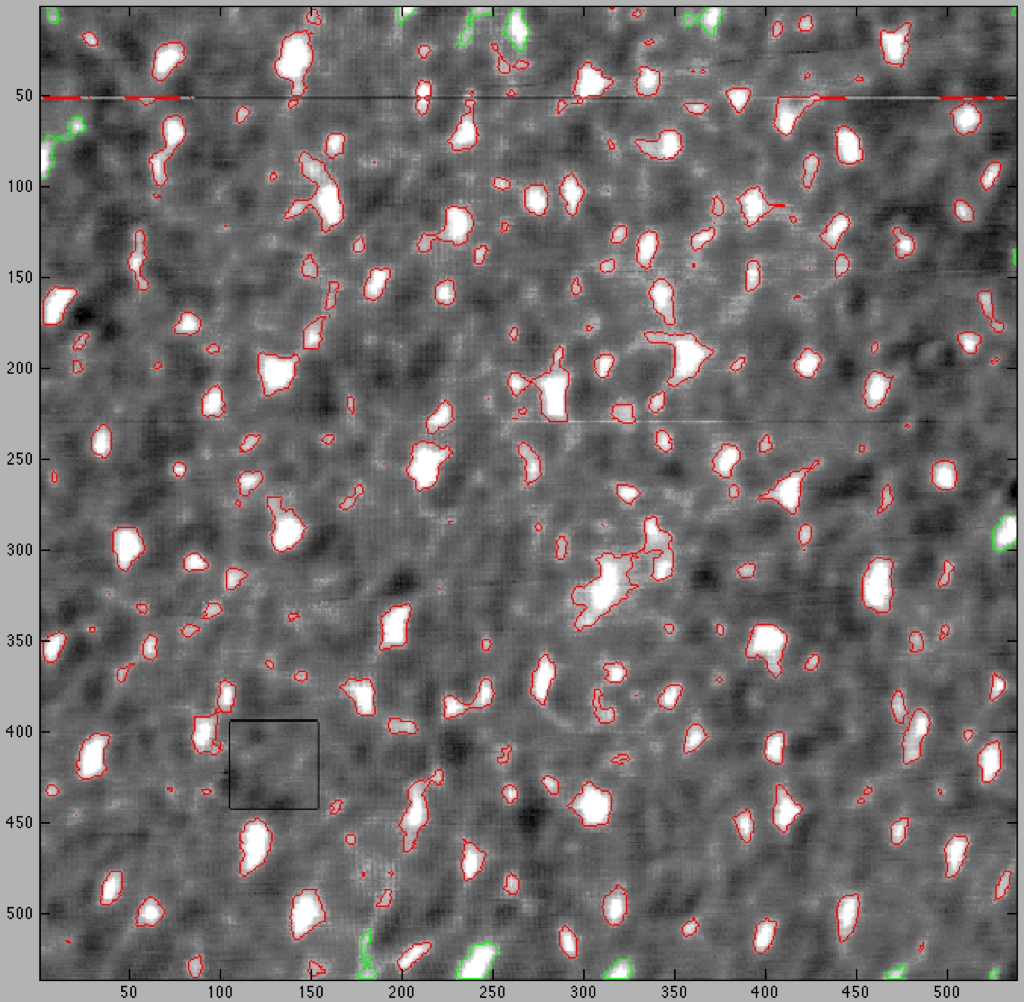
This is a continuation of the last post on AFM analysis of pore changes during discoloration. I took the AFM images, inverted them in ImageJ so that the pores would be white and then did PoreProcessing in MATLAB. I simply selected a threshold but did no binary operations. The calibration for these AFM images was 0.55 pixels/nm. It seems like the threshold was pretty good – I may have missed some of the background pores but not many.
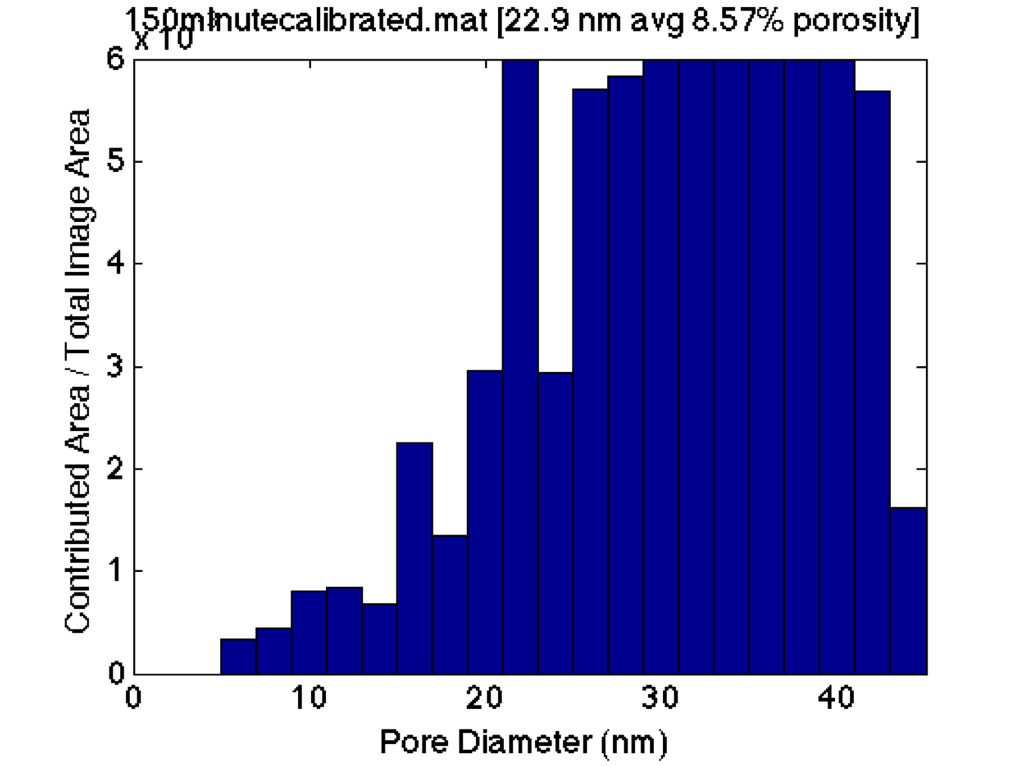
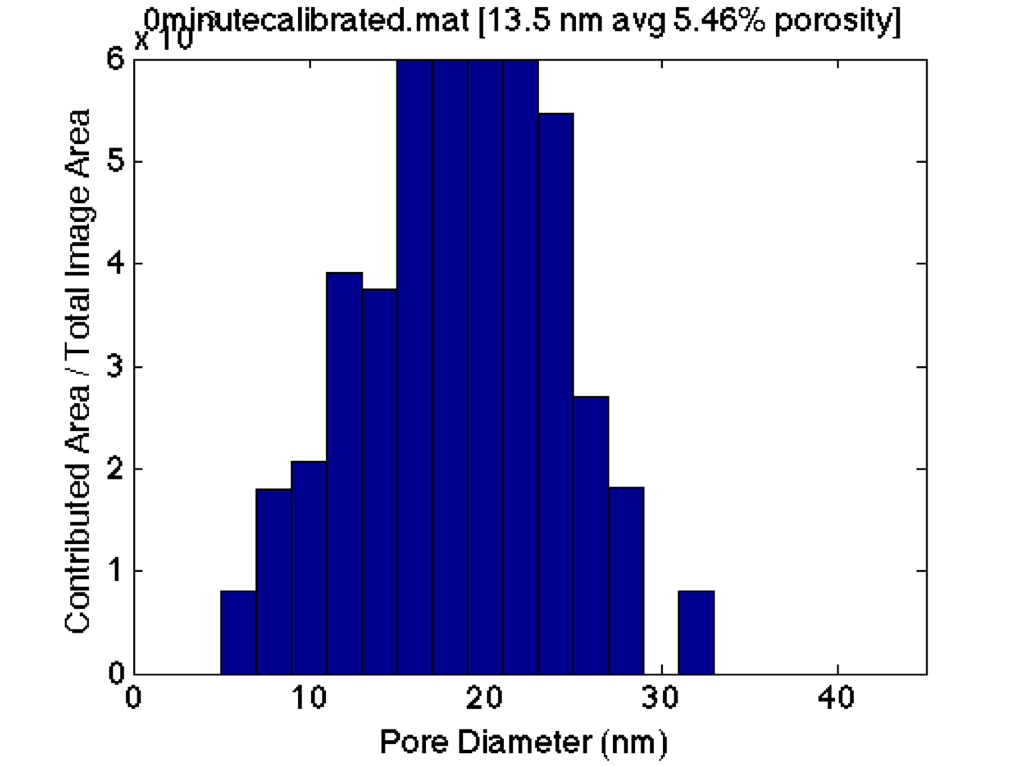
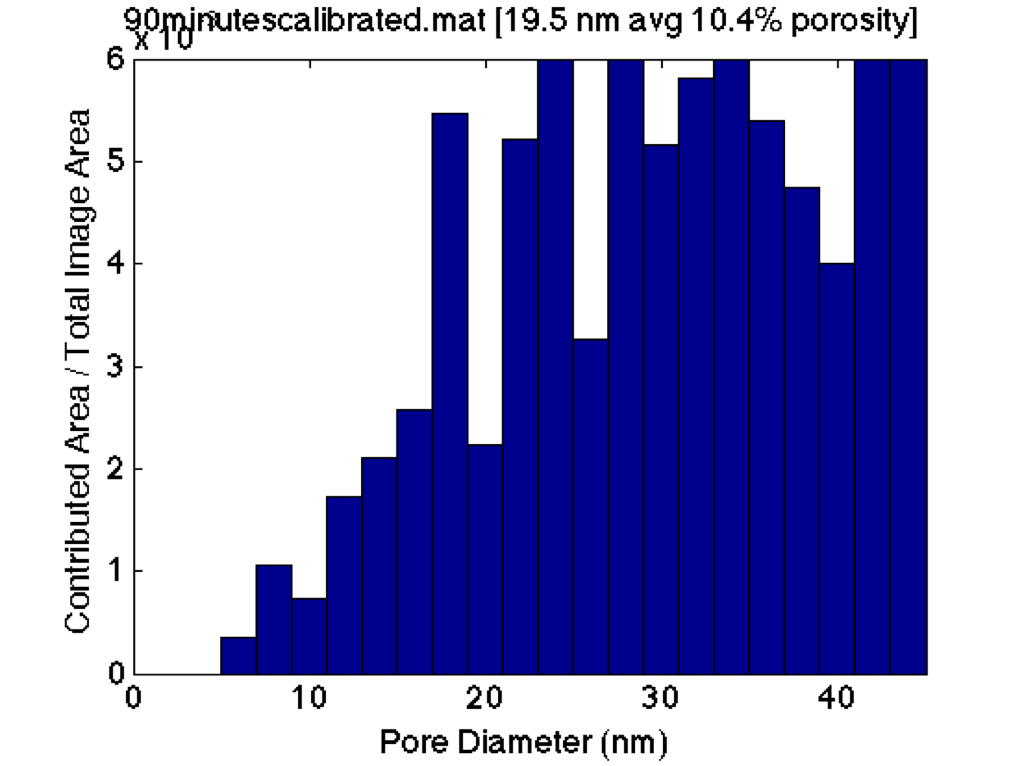
The histograms showed an increase in pore diameter from ~ 13nm to ~22nm from 0 to 150 minutes. This agrees pretty well with Anant’s analysis from TEM images here. Taken together, it seems like pore diameters are increasing during discoloration.
Time = 0 minutes
Time = 90 minutes
Time = 150 minutes