Scale Up Experiments
Hello Everyone,
So as you probably remember, we were able to show the capturing and releasing successfully.
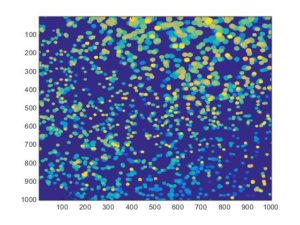
In addition, we have a Matlab Code now which helps us for intensity change, so as you can see in the next figure which is the analyzed data for videos at the top, it shows capturing gradually and sharp drop in intensity and also being able to release all the captured beads which are all in agreement with videos.

We solved the problem with delay in GFP and DIC by applying Greg’s idea from last NRG. So we have one background DIC image before running the sample and then we merge all the GFP images with that background Image.
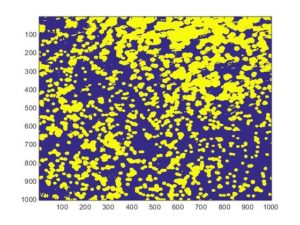
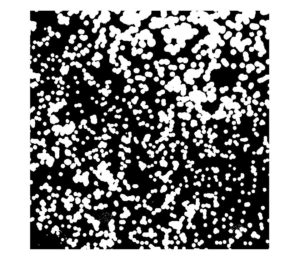
With Henry and Sean helps, now we are able to even count the number of beads that are captured, so for this Matlab code, we first assign a number to each bead based on for how many images it’s been sitting on the membrane, So the strong orange color means bead that has been sitting there from the beginning till the end, but in other hand, the blue color means bead that was in the system for few images which again means it was floating/passing and not being captured. Then by putting a threshold of 3, we cut all the beads that are only in 3 images (Floating beads). Then by changing them in black and white binary system, we can measure the total white region. Eventually, by dividing the total white region with white region for a single bead, we can calculate the whole number of beads. we also double check the counting by another way, which is basically a counter which counts beads that are in the system more than 3 images. we have a graph also that shows how gradually is capturing happening and the fact that by filling up the pores by beads we expect to capture less beads because of decreasing in the transmembrane pressure which is also shown in the figure (the slope is decreasing means the capturing rate is decreasing)

In order to have a sense about our system, i calculated the number of pores and compare the results with the number of beads. the result is in agreement by the video which shows saturation of the membrane surface by beads.
Porosity: 10^5 pores/Cm2
Interaction area: 3.14*10^-2
Number of Pores: 3140
Number of pores in Image Area: 1720
Number of Captured Particles: 1553
Phil’s Experiment: (Sheer force)
For this experiment, an equal volume of DI water was pushed past the membrane with captured beads at increasing flow rates. The top channel is entirely closed off in this experiment, so their is no outflow from the top channel.
20 microliters/min – 3 min
40 microliters/min – 1.5 min
60 microliters/min – 1 min
80 microliters/min – 45 seconds
100 microliters/min – 36 seconds
The beads remained locked to the membrane even at high flow rates. This data has now been taken in triplicate.
Minimum flow rate
The purpose of this experiment was to try to isolate the lowest flow rate at which we could maintain bead capture. Five different flow rates were tested (10, 15, 20, 25, 30 microliter/min), in between increases fresh bead solution was added to the pushing syringe. The samples were each pumped for five minutes. The 10 microliter/min sample could not keep beads in the interaction area, and as the flow gradually increased, the number of beads maintained in the solution pushed past the interaction area increased (clearly an expected result). We found that beads could be kept afloat in the solution at as low as 15 microliter/min flow rate. The provided videos show the difference between 10 microliter/min and 30 microliter/min.