Discoloration Array (revisited)
I repeated Barrett’s discoloration array experiment (Array1, Array2). NaCl solution was prepared @ concentrations: 0, 0.25 (0.1), 0.5 and 1M, whereas NaHCO3 solution was prepared @ 0, 0.475, 0.95, 1.90 (and 3.80) mg/ml. Different combinations of both these salt solutions were used and discoloration of non treated samples in oven@ 37C was monitored over different time points.
The sample in high NaCl and high NaHCO3 is expected to discolor the fastest and that is what can be seen in the following sample images from W747:

The following image shows the (1M NaCl+0.95mg/ml NaHCO3) sample being the same as the first time point instead of what can be seen above, where the sample seems to have gathered debris and reflect golden color.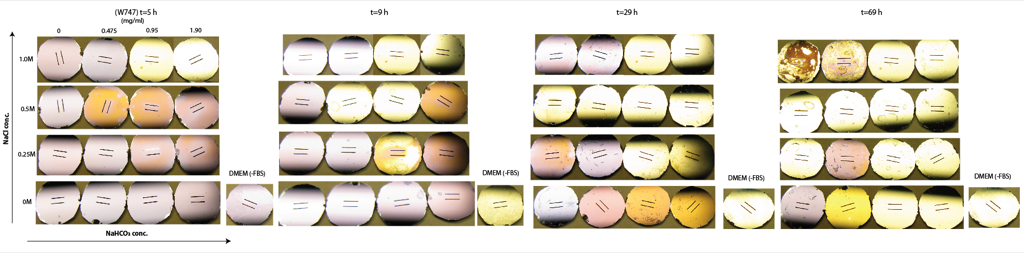
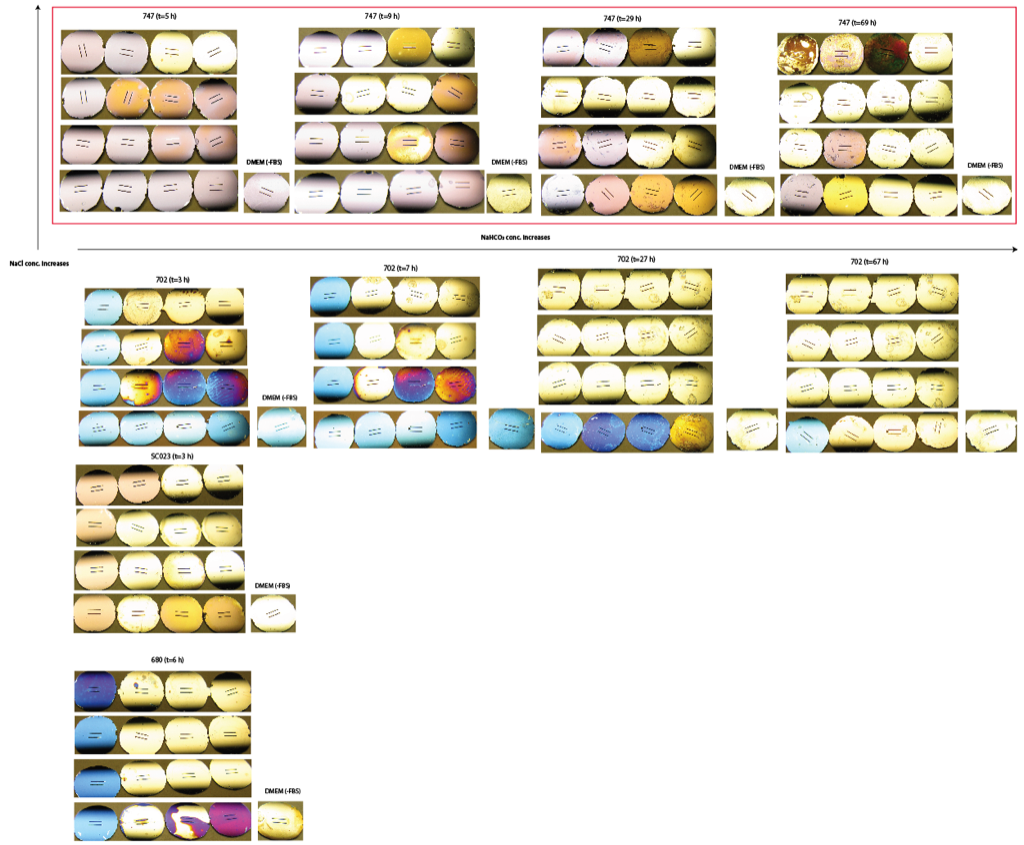
Another trial shows similar result with W702:

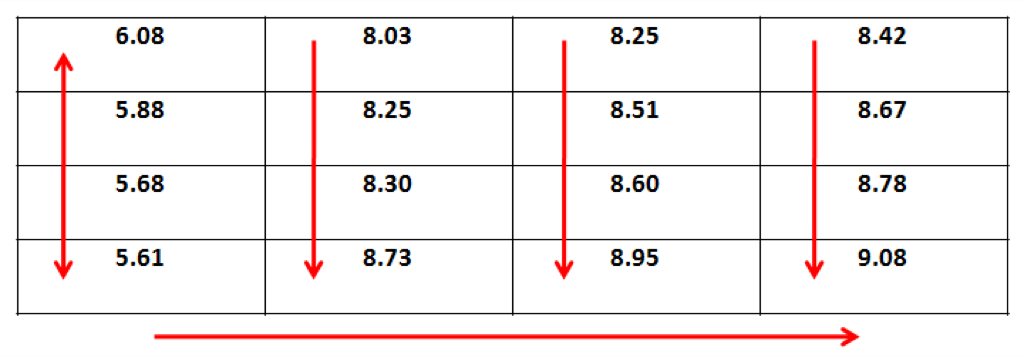
Following table shows the pH matrix at t=0,
The matrix below gives an overview of all the trials conducted:
I gave another shot at this using smaller concentrations of sodium bicarbonate. Samples were taken from W703 (no RTP) and nothing expected took place. (similar to Barrett’s results)
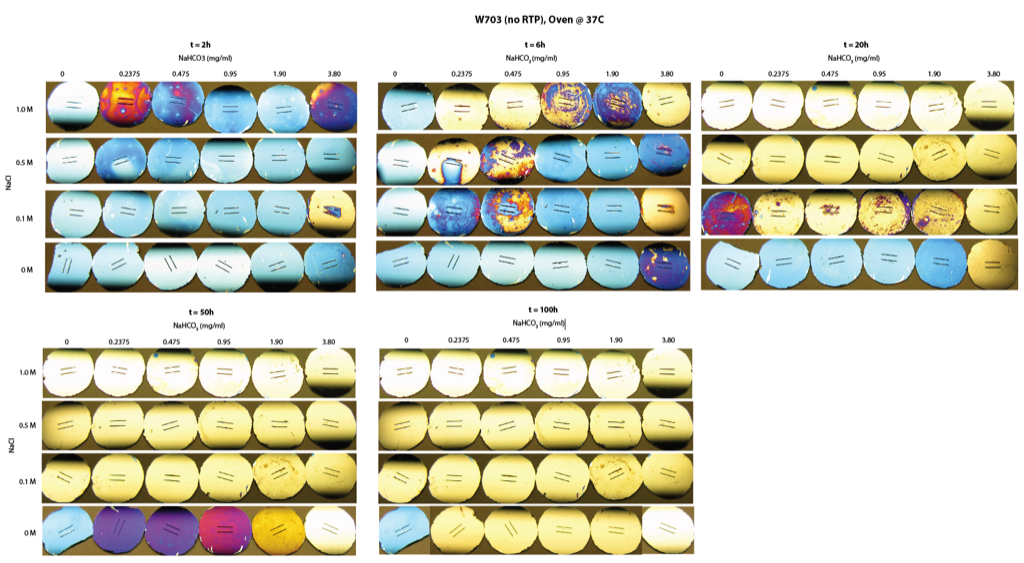
Discoloration increases with increasing conc. of NaCl in bicarbonate free solutions and similarly, with NaCl free solution the increase in bicarbonate conc. increases discoloration.
Where are the zero time points? I worry that the color change is too subtle to interpret unless the membrane begins blue. Changes in photography conditions could account for some of what I’m seeing with the ones that begin goldish.
For the others, we are still getting non-monotonic behavior. It seems that salt causes discoloration by a mechanism that the bicarbonate provides some protection against. But yet in the absence of salt, the addition of bicarbonate catalyzes discoloration. This is exactly what Barrett saw.
Can we make these same mixtures of salt and bicarbonate and give an array of pHs please. Barrett might have already done that, but I can’t find it.