Electroosmosis Bits and Pieces
This post explains that electroosmosis in our material is higher than we expected. Jim suggested that maybe we don’t have fully developed flow in our thin material. Here I attempt to find the entrance length, or distance until fully developed flow, in our material. One needs to keep in mind that this is a continuum equation and we may not being in the continuum regime.
le = .06 × Re × D = .06 × ρVD/μ × D
where le is the entrance length, Re the Reynold’s number, D the diameter, ρ density of water, V velocity, and μ viscosity of water.
To find the velocity (in m/s), I’ve taken our flow rate in electroosmosis (in μL/min) and divided it by 60 and the active area:
V = (7 μL/min) / (60 s/min × .4 mm2) * 10-3 mm/m = .29 × 10-3 m/s
For comparison’s sake, let’s look at our membranes and CNT membranes under pressurized flow:
Vpnc-Si = 23 cm3/(cm2 × min × bar) × (1/60) min/s × 10-2 m/cm = 3.8 × 10⁻³ m/(s × bar)
VCNT = .8 cm3/(cm2 × min × bar) × (1/60) min/s × 10-2 m/cm = .13 × 10-3 m/(s × bar)
So for 1 bar of pressure, our membranes have a velocity of about 1 order of magnitude faster flow under pressure than for electroosmosis at 15V. Electroosmosis is faster than pressurized flow with CNT membranes.
One more adjustment before finding the entrance length. I think that we need to further modify the active area to take into account only the active pore area, as a higher porosity would give a higher flow rate and thus higher velocity if we don’t normalize by porosity.
V = .29 × 10-3 m/s ÷ 2% = 14.5 × 10⁻³ m/s
Now we can find the entrance length:
le = .06 * (997 kg/m3) × (14.5 × 10 -3 m/s) × (15 × 10-9 m)2 / (8.9 × 10⁻⁴ Pa s) = 2.2 × 10⁻¹³ m
This is saying that the flow is fully developing immediately as it enters the pore. If my numbers and assumptions are correct here, than there would be no benefit as far as the flow profile goes with a shorter channel.
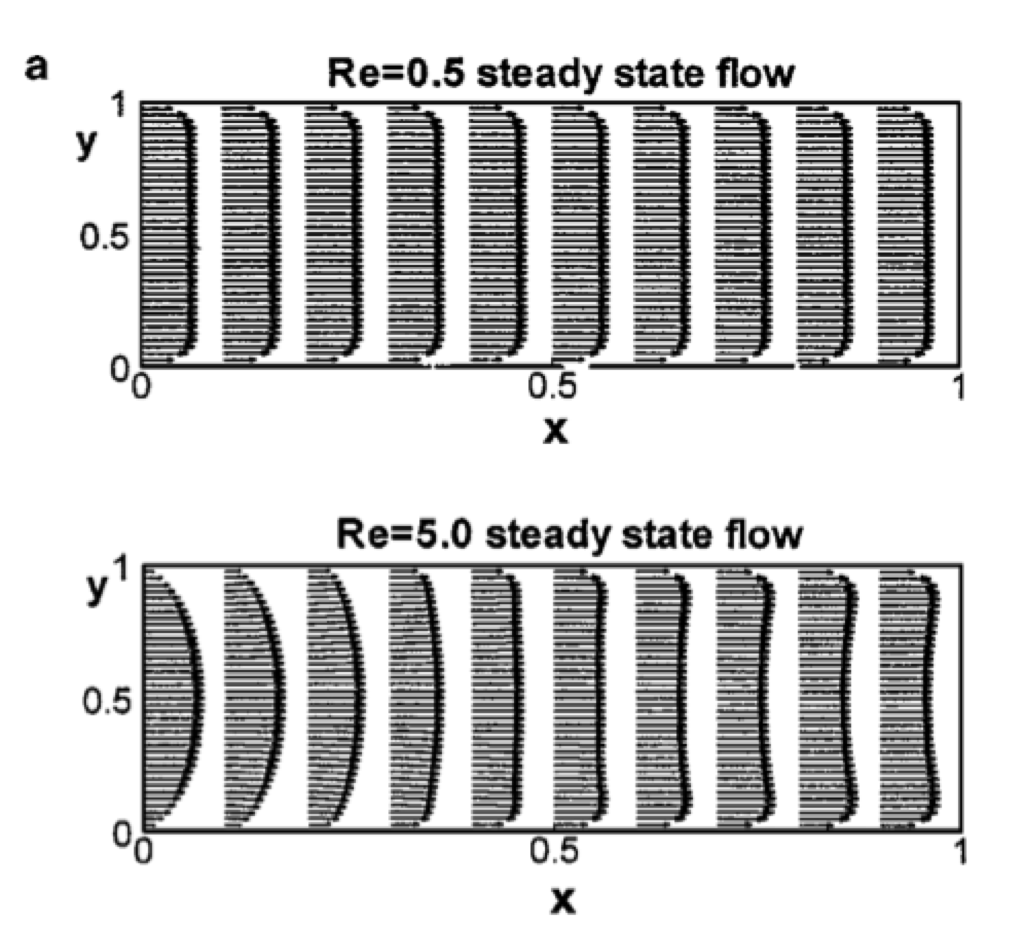
A paper by Yang(Hwang) – J. Colloid Interface Sci. 244 (2001) – agrees with this result in microchannels with electroosmotic flow. This figure shows that at low reynold’s number, the profile is developed instanaeously, while at higher reynold’s number there is a longer entrance length.