Getting linear standard fluorescent curves with the Tecan
Now that we have preliminary transport data from the Tecan, we need standard curves in order to get permeability coefficients. This is really tricky because the RFU (relative fluorescent units) are arbitrary and based on the Tecan gain. For example, a solution of 10uM rhodamine might be 5000 RFU with a gain of 80 but 20000 RFU with a gain of 100. There are 3 options for setting the gain: manual (you tell Tecan the gain, e.g., 75), optimal (Tecan figures it out based on all scanned wells) or by well (you tell Tecan which well to look at, e.g., A1). The gain can be 1-255, and it controls the amplification of the photomultiplier tube. According to the manual, the PMTs are spec’ed to a certain relatively high voltage range, so you should NEVER use a gain <60.
I was interested in finding a linear standard curve with broad applicability. After much discussion, Jim and I thought it made the most sense to adjust the gain in order to eliminate all nonlinearity. To do this, I made serial dilutions of sodium fluorescein (Na-F) starting at 0.02% (the recommended concentration for cell monolayer permeability studies). I told the Tecan to calculate the gain based on a specified well. I started with the well containing the highest Na-F concentration (this is what Erik recommended). In subsequent scans, I set the gain to the next lowest concentration (.002, then .001, etc.). To speed up scanning, I did 4 scans per well in the “x-direction” and to minimize cross-talk between wells, I used a 2000um border.
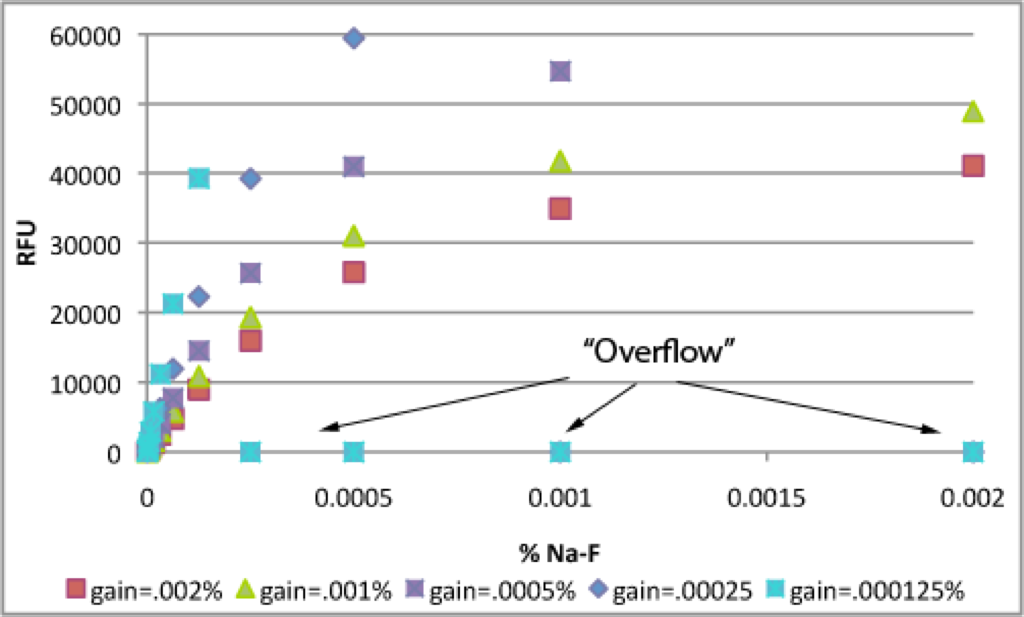
The first thing you notice in the next 2 graphs is the obvious non-linearity at high concentrations. These solutions are simply too concentrated. More importantly, if you look carefully, you can see the optimal maximum RFU. Although the RFU scale is 0-~70000, the detector only has a linear response to input light up to a certain level. This level is ~40000-43000 RFU. I know this because when the gain was set to the 0.002% well, RFU was 41083, when it was set to the 0.001% well, RFU was 41775 and when it was set to the 0.00025% well, RFU was 39215. Even though the machine will output higher RFU values, the accuracy of these numbers is suspect. Think of this as equivalent to the ambiguity of absorbance values above 2.0-3.0 OD.

This is a closer look at low Na-F concentrations. As I decreased the gain by telling the Tecan to calculate it off of lower Na-F concentrations (see table below), the standard curve became more linear. When I set the gain off .000125% (gain = 88), samples > .000125% were much more fluorescent than .000125%, so they were off scale and the Tecan output “Overflow”.
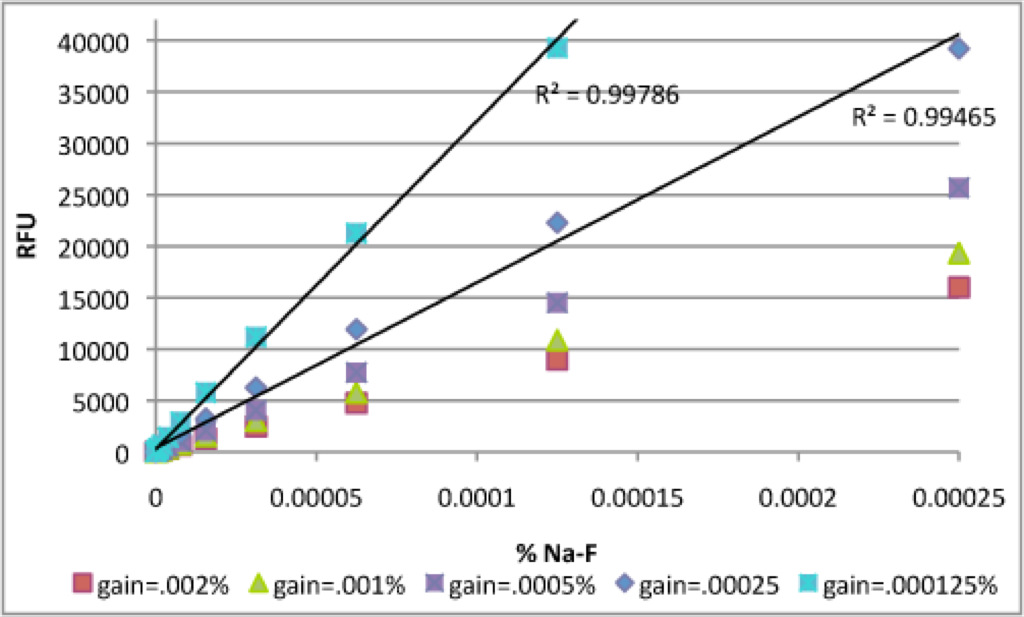
Although the gain=.0005% curve overshoots the optimal maximum RFU, it looks pretty good below ~ 40000 RFU. I zoomed in and compared this curve with the gain=.000125% experiment. It looks like the 0.000125% data is best. The entire range of concentrations below .000125% is in the linear regime. If you’re interested in slightly higher concentrations of Na-F, the gain=.00025% curve would be a good compromise.
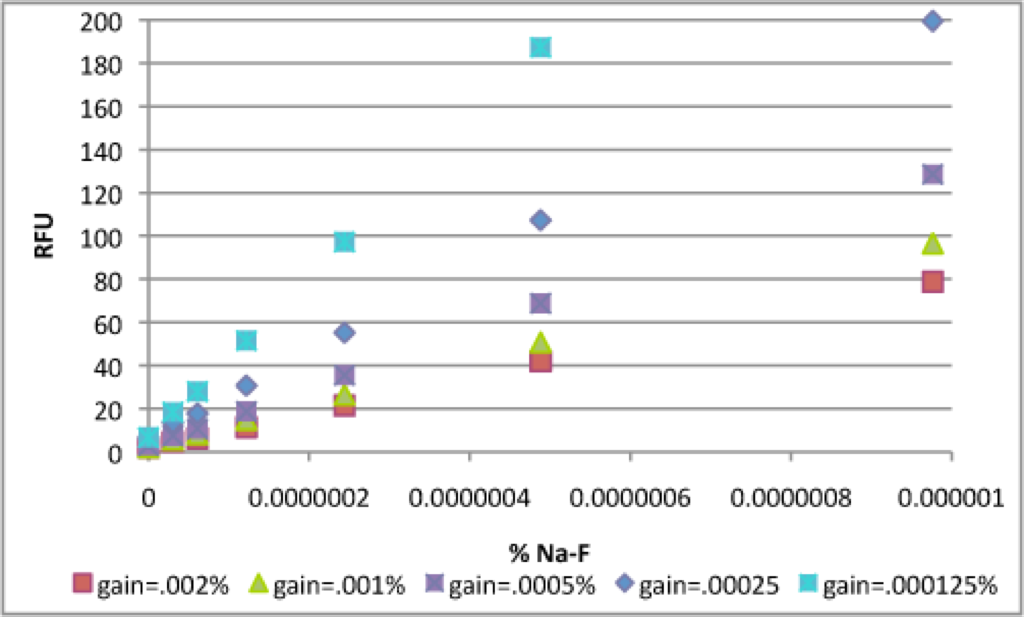
For extremely “dim” samples, the RFU’s are higher with the gain at .000125%, as expected (since the actual gain is 88). However, you lose the ability to detect highly concentrated samples.
What is the actual gain when you tell Tecan to set the gain off a certain well?:
| Well (% Na-F) | Actual Gain | Well (uM Rho) | Actual Gain | |
| .02 | 71 | 500 | 81 | |
| .002 | 71 | 125 | 78 | |
| .001 | 73 | 31.25 | 77 | |
| .0005 | 76 | 7.8125 | 83 | |
| .00025 | 83 | 3.90625 | 90 | |
| .000125 | 88 |
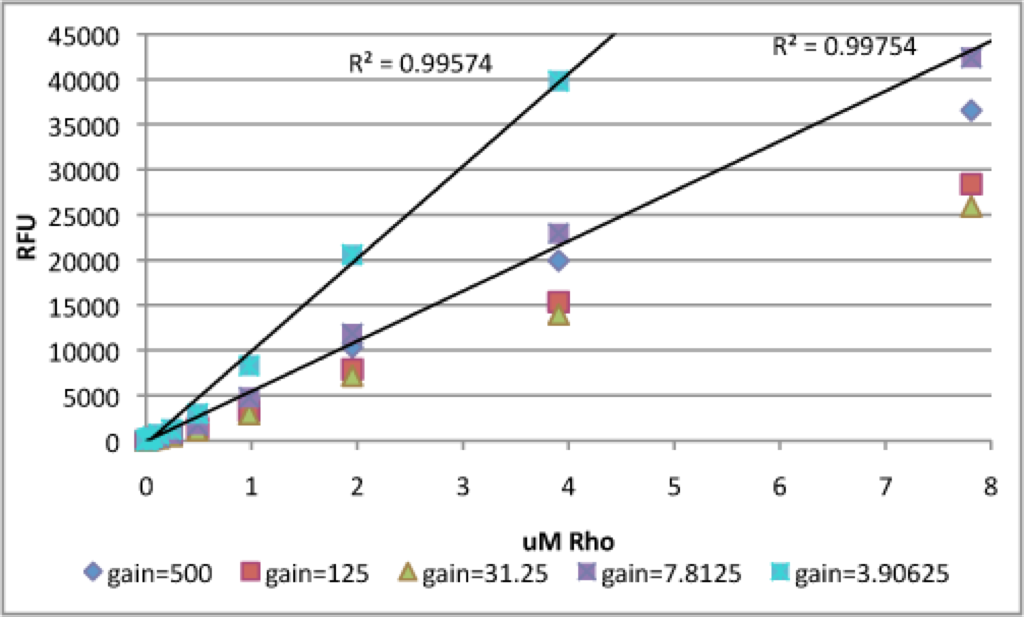
To test the utility of this protocol, I repeated these steps with rhodamine 6G. You can see some of the same trends with rhodamine as with Na-F. First, the concentration on which the gain is set is assigned an RFU ~ 40000-45000 (the magic optimal maximum). In contrast to Na-F, fluorescence increases even though rhodamine concentrations decrease from ~ 500 – 31.25 uM rhodamine. I believe that this is due to absorbance of excitation and emission light by highly concentrated solutions of rhodamine, which effectively decreases the fluorescent output of the well.
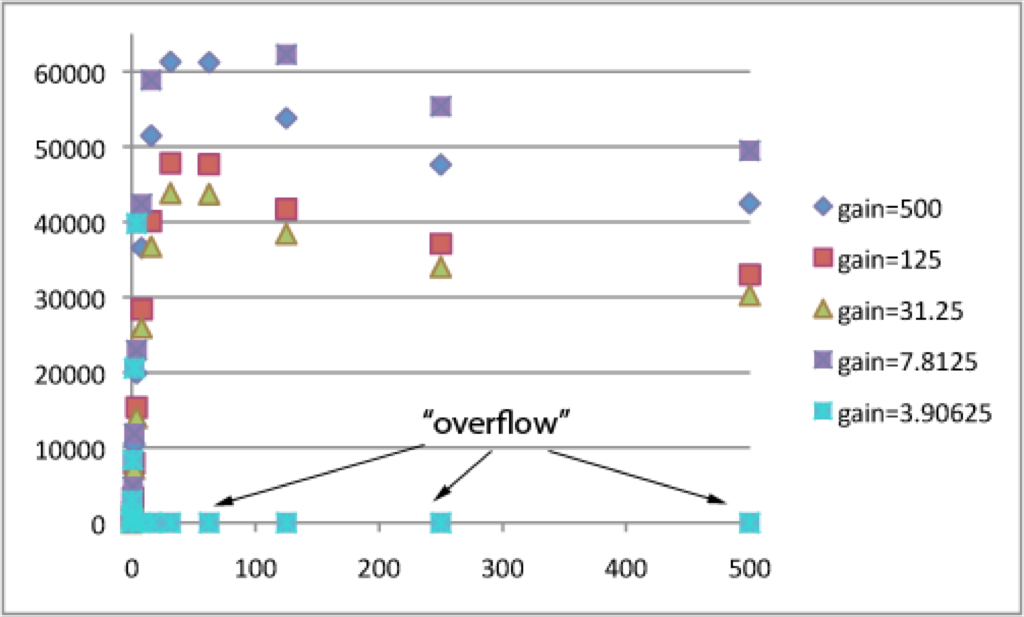
This graph shows the increasing linearity with decreasing the concentration on which the gain is calculated. This exactly matches the observations with Na-F.

Again, I couldn’t tell which curve was more linear, so I zoomed in and fit lines. Even though the gain=7.8125uM line overshoots the optimal maximum RFU, it is linear below this optimum. The gain=3.90625uM curve is linear for the entire region but has a strange dip at very low concentrations. I think either of these curves would be appropriate.
Since this approach worked for both fluorophores, I think it is a general protocol for finding standard fluorescent curves with the Tecan. In brief, you make a dilution and decrease/increase the gain until the curve is linear up to the optimal maximum. Note this gain value. Make your standard curve in this linear region with the calculated gain. Do experiments with gain set to whatever was calculated and then compare to standard curve for concentration values. I will convert this post into “protocol format” and add it to the protocols section.
Awesome job Barrett.
What algorithm does the software use to determine the optimal gain? I’m just trying to figure out what setting the gain to “X concentration” means. Since gain is unitless, does the tool just choose a gain that yields the 40000 RFU number with the standard illumination in the well with that concentration? For very sensitive studies, I assume that gain would probably be higher, since there seems to be quite a bit of room at the high end? When we return to labeling proteins, I assume the effective concentrations of fluor will be comparatively lower than these? Or is this the expected range?
The gain is directly proportional to the voltage applied to the PMT. There must be a range of high sensitivity for this instrument and the upper limit of that range is ~ 40000 RFU for whatever gain. I think that when you tell the machine to calculate the gain off x concentration, it will read the emission intensity in RFU and then reduce the voltage to the PMT until that RFU value is at the magic optimal maximum gain. Then it tells you what that gain is. I agree with your assumptions. For highly sensitive studies, the gain can be increased and I imagine the detection limit will go down. However, we’re already pretty close to the detection limit.
Keep in mind that this standard curve is specific for 24-well plates for transport studies. Other assays will require their own standard curves.
Also, remember that setting the gain off of a well with x concentration is different than setting the gain to “Optimal gain”.