Integrated Nano Technologies – Gold Flow
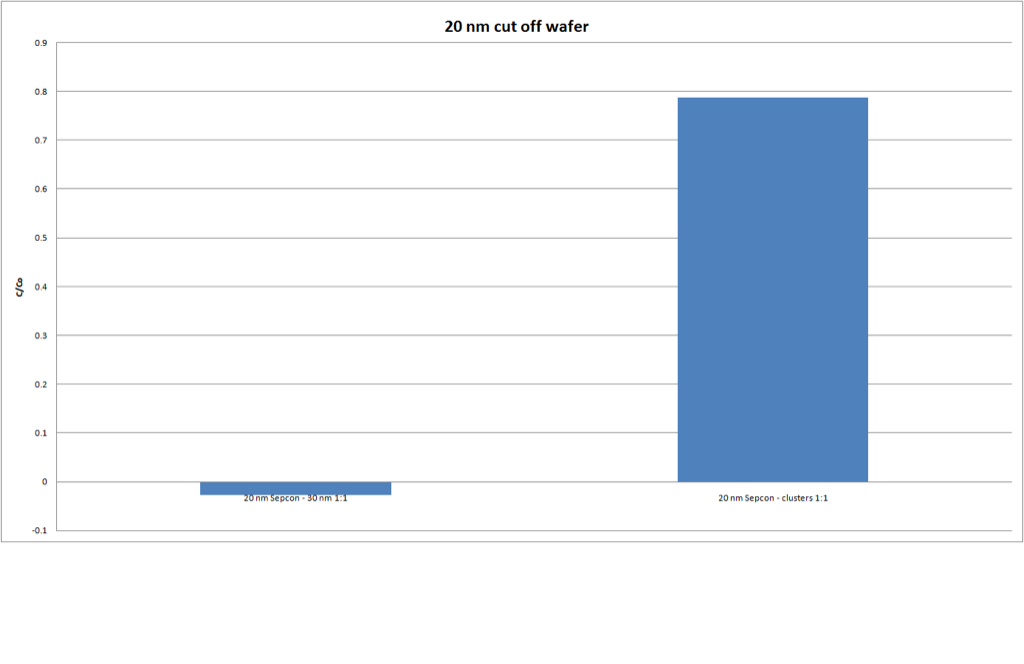
To this point, I have shown that our membranes are stable with the use of INT’s developer over time. I have also shown that their developer has statistically similar flow properties to that of water, and is a viable option to pass through our membranes. This post will discuss the possibility of using their unique nanogold “clusters” to pass through our membranes and then be developed using their developer, which I have already shown to be viable. According to INT, these are 5 nm gold clusters with some sort of polymer coating. They are also not sterically stabilized. The graph below shows my first trial using a 20 nm cutoff Sepcon with 30 nm gold as a control and their clusters. I was excited by the result at first, as the sieving coefficient (C/Co) for the 30 nm gold was around 0 and it was just under 0.8 for the clusters. This originally showed that we could pass the clusters and hold back larger gold.
However, when trying to repeat this experiment, I was unable to get the clusters to flow in a number of different conditions. I tried flowing them in the centrifuge and in the pressure cell, 20 and 30 nm cutoff membranes, and at very dilute concentrations (1 to 20) for approximately ten additional trials. There was no flow whatsoever in Sepcons that had INT gold clusters trying to pass.This led me to believe that the first trial I ran had a leak or pinhole that may have been missed. I used water and/or 10 nm gold as a control in these experiments to prove that the Sepcons were still behaving as we would have expected. Below shows an experment using 10 nm gold as a control in a 30 nm Sepcon cutoff, and the INT clusters.
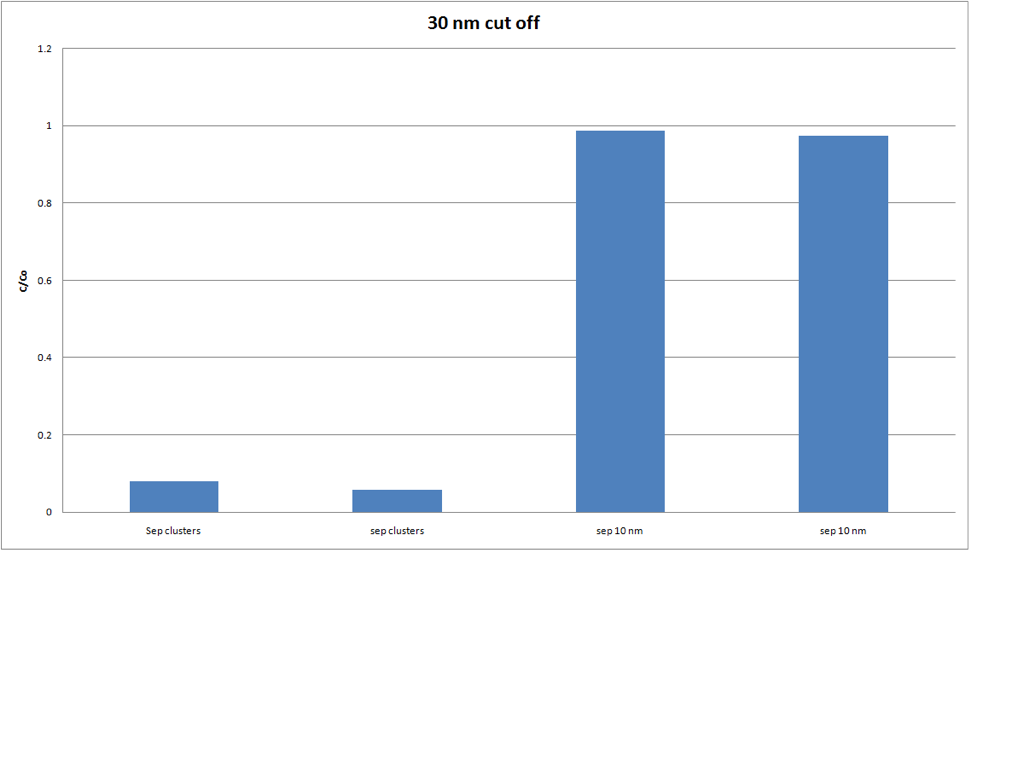
This experiment clearly shows that I was able to pass 10 nm gold (sieving coefficient of above 0.9) and not able to pass the gold clusters (sieving coefficient of below 0.1). Since INT told me that these gold clusters were 5 nm, these experiments were very surprising. To try and explain these results I did the following malvern scans:
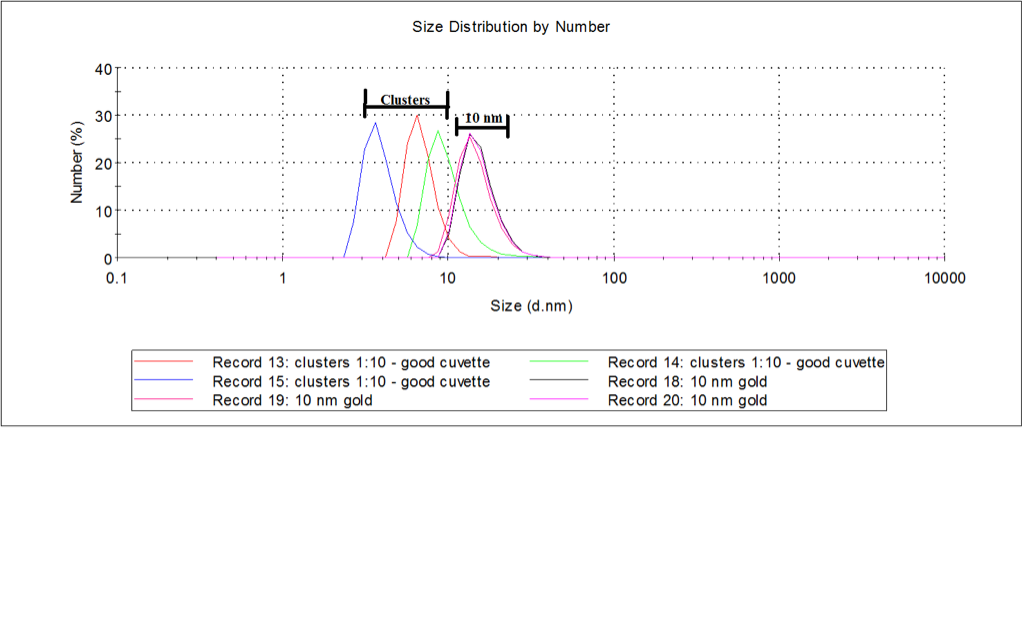

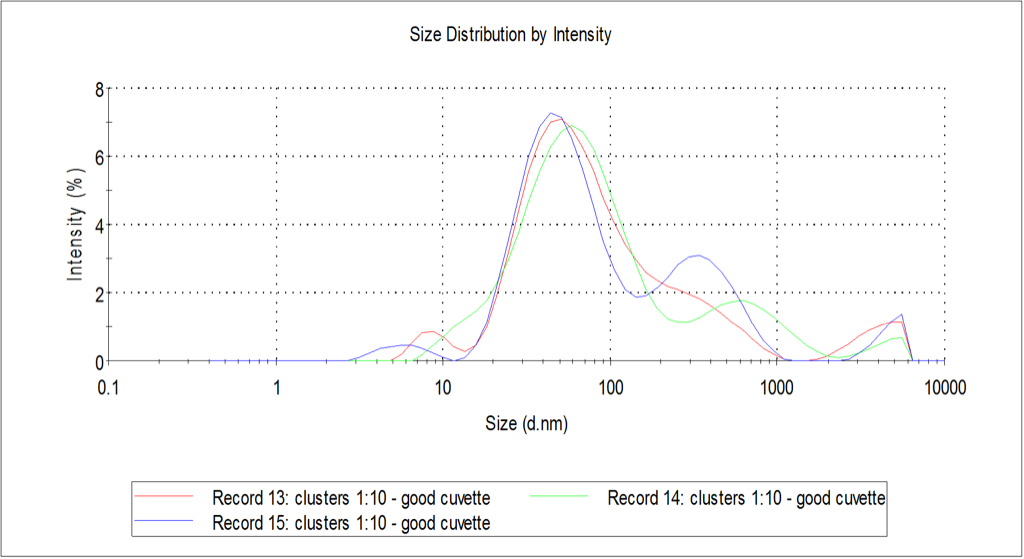
The first of these plots show a range of clusters being between 4-9 nm and the 10 nm gold were measured around 11 nm. The second plot shows the intensity of the 10 nm clusters, and by far the biggest peak is that around 10 nm, with minimal effects from larger species in the solution. The third plot shows the intensity scan of the clusters. Here, the most important particle size by intensity is a peak around 60 nm. This explains why our membranes are not flowing their clusters. It is clear that there are larger particles in their “cluster” solution that is causing their to be clogging or no flow through our pores.