A quick graph showing that a higher active area/inactive area ratio sees less pore blockage
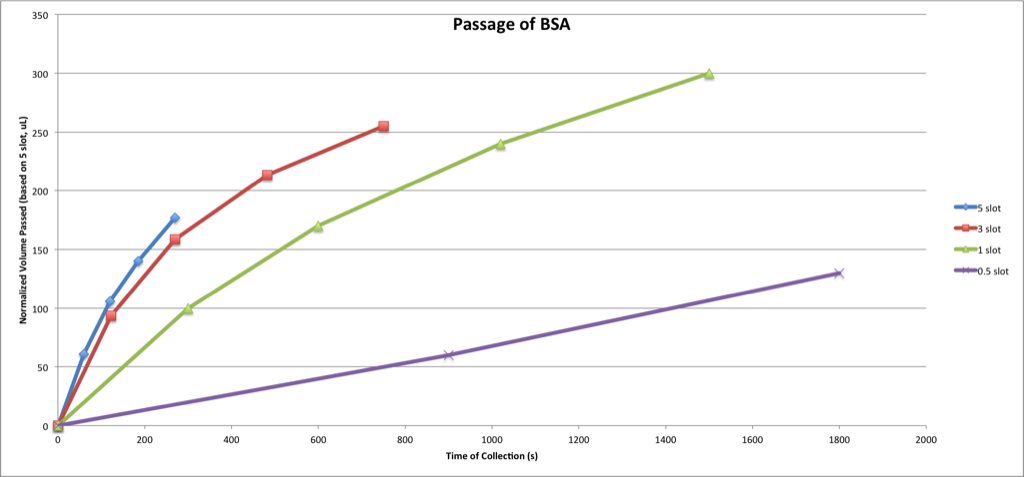
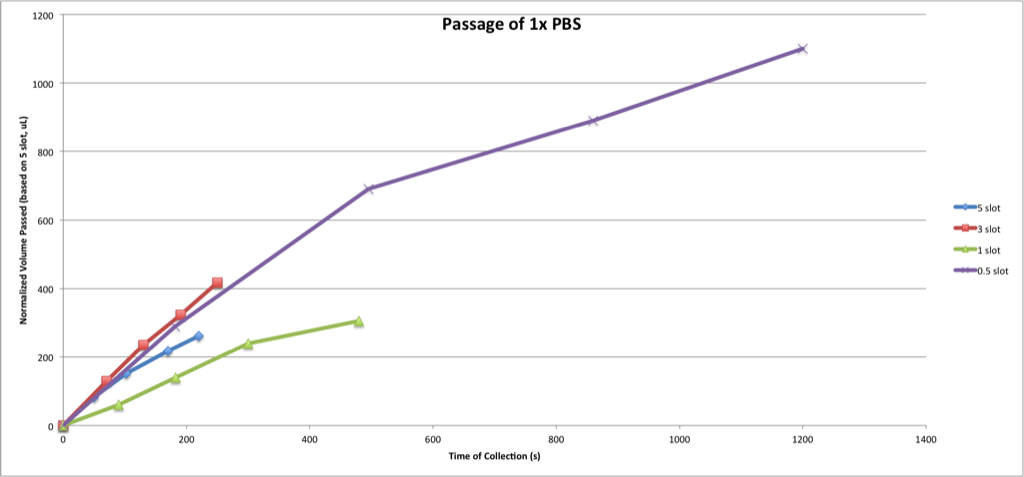
These volume measures were conducted at 5.6 +/-0.2 PSI using the variable area sepcons with either a half slot, one slot, three slots, or the normal five slots. Note that the pressure was normalized via a pressure regulator, and this normalization was confirmed with a manometer. Filtrates were collected in a series of the lower sepcon baskets. The lower sepcon baskets can vary in weight by as much as 0.021g, so each sepcon was weighed beforehand to verify that it was within 0.002g of an arbitrary standard. Sepcons were wetted with 1xPBS and tested for integrity via a brief spin (2000rpm for 5 min) in the centrifuge. TECAN scans of each starting solution and each filtrate were taken to verify that concentration of BSA in the filtrate and across the different starting solutions were consistant. Hydraulic permeability was also measured (albeit with non-pre-weighted sepcons) and is below:
I think the reason slot one deviates so much is because the sepcons weren’t pre-weighed.
Josh calculated a porosity of 7-8 % and an average pore diameter of 28 nm. For reference, BSA has a hydrodynamic diameter of 7nm. The stack was a typical 25-30-25 with a 1050 C 100 C/s 60 s RTP.
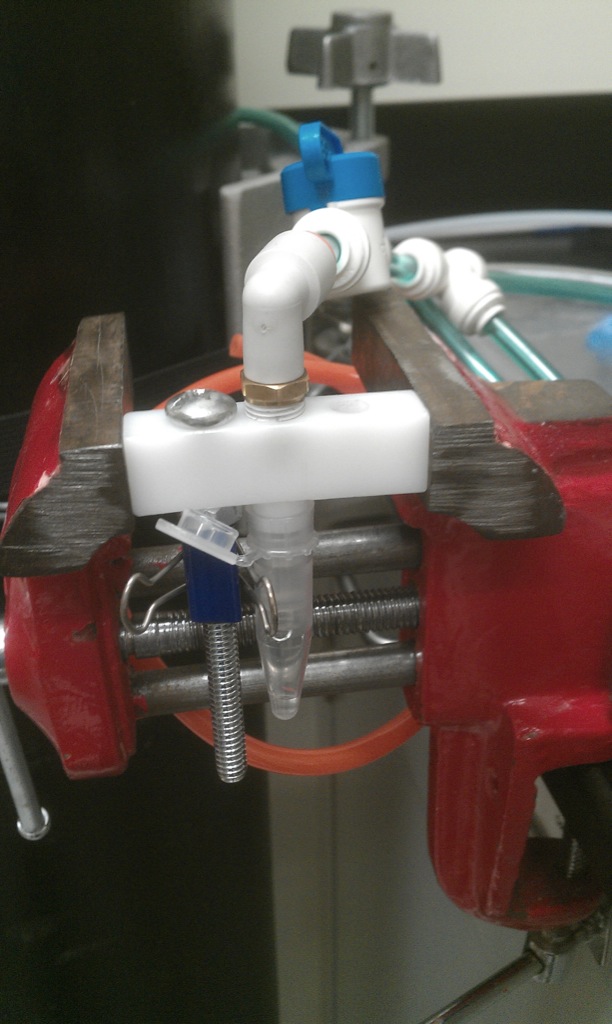
As a final point, here’s a picture of our setup:

Note that I switched out the regulator on the nitrogen tank. The old one was consistantly off by 20 PSI:

And the new one seems pretty accurate.
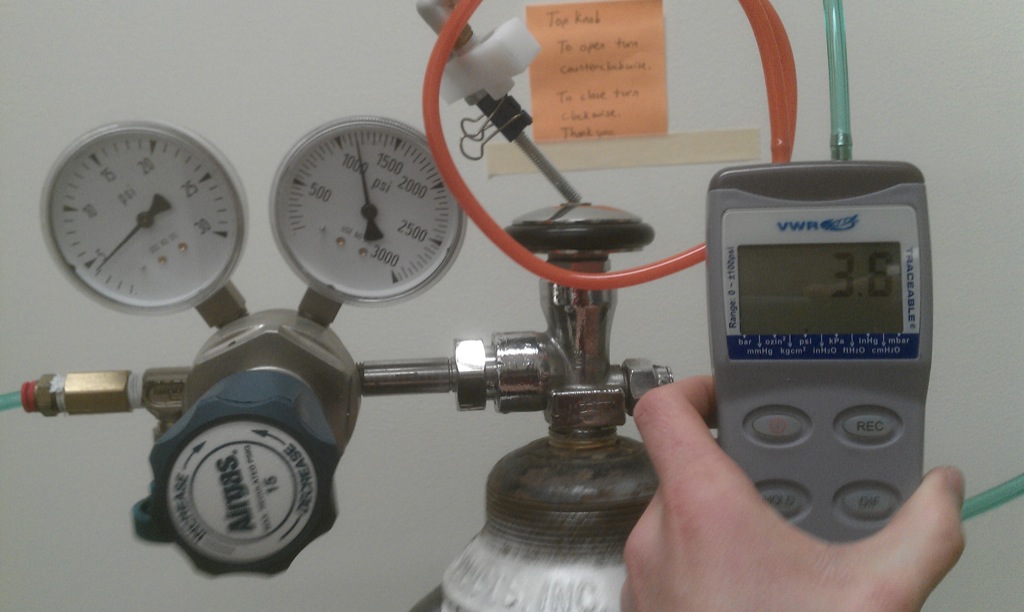
If you use the regulator to set the pressure it’s much easier to control pressure across several experiments.
Two things I would like to see added to this post: plots of permeability vs. volume passed for both buffer and protein. In the absence of protein the permeability should be the same value for all membranes and all times. In the presence of protein the permeability should drop as more material has passed and the retentate concentrates.
The question is, do lower active areas have a lower capacity for passing protein than higher active areas? Its hard to say from the current plots because different amounts have passed through the different membranes and so the retentate should be concentrating much more in the case of the larger area membranes at a given time point.
Why do we care? Because our past comparisons to commercial devices have not been favorable – far less volume passes through our small area membranes before they ultimately clog. Shouldn’t be, but seems so. Before we worry about mechanism, lets see if this result holds.
All that said – you passed quite a bit of fluid through the large area membranes in 5 min at only 5 PSI. What is the BSA concentration?
I plan on getting hydraulic permeability today (I did do one test, but at that time I wasn’t pre-weighing the sepcon baskets and the results are noisy). The aliquots I used were 1mg/mL BSA. I took TECAN scans of the mixed retentate (you can’t void the sepcon completely without breaking the membrane, so some buffer was left) and typical starting concentration was ~0.9mg/mL BSA. The filtrate for the 5, 3, and 1 slot wafers was all ~0.75mg/mL BSA. The filtrate for the half-slot wafer was noticeably lower, ~0.5mg/mL. Look for some plots of volume passed v. permeability later today.
This post was discussed for a long time at NRG, as none of us could find a way to explain the data. Since the first plot is already normalized for the membrane area, the smaller membrane areas just pass less fluid for no apparent reason. When Karl plots against volume it will probably be even more dramatic that for a given volume passing per unit area, a small membrane plugs with much less protein passing through it – with everything normalized. The conclusion seemed to be that it was non-physical or there is something that we are all missing….IF it’s real it would be very interesting, but there’s lots of skepticism, and curiosity at this point.