A nifty little Matlab code to show why we need to wet the backsides of the membranes
I couldn’t really make sense of what was happening in this post, and in particular this figure threw me for a loop:
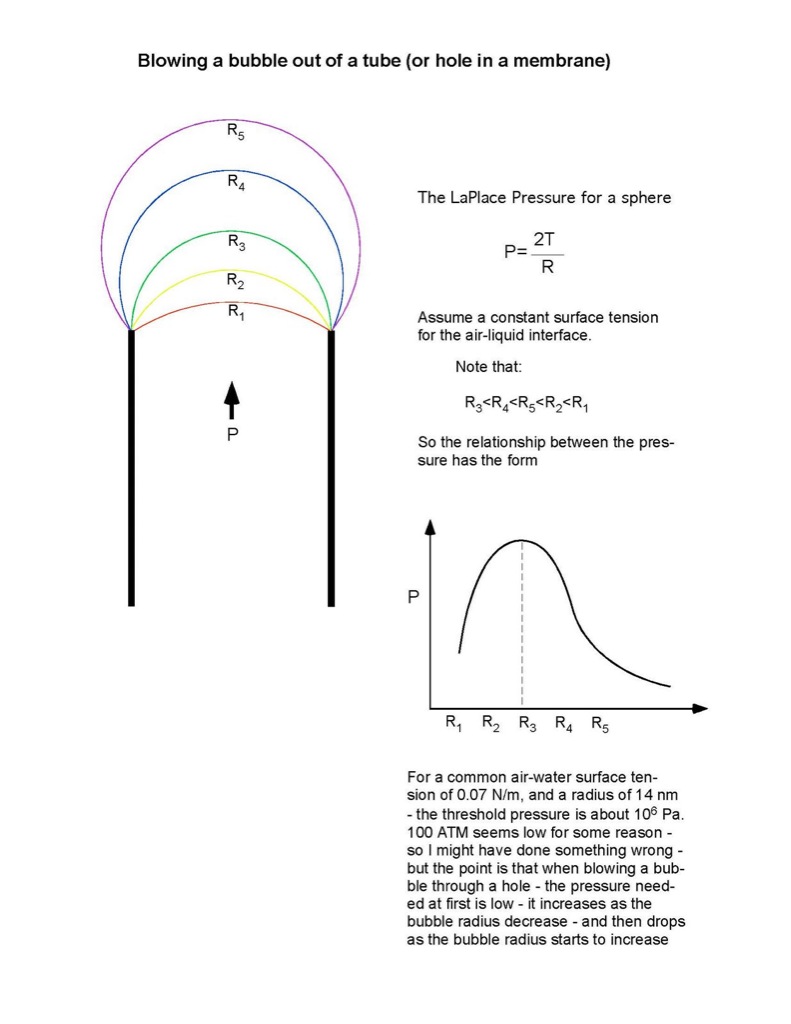
So to help myself understand the relationship I whipped up a little matlab app to show the relationship a little clearer:
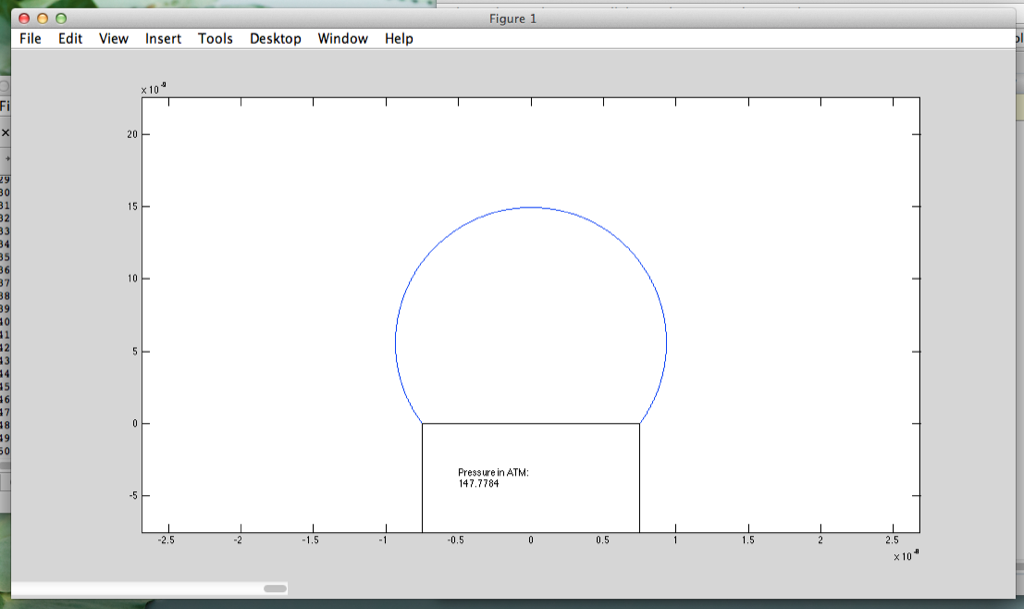
Moving the sliding bar on the bottom changes the y-position of the center of the ‘droplet’. Note that there is a very apparent maximum at 184ATM, when the drop’s radius is the same as the capillary’s radius.
I apologize for the messiness of the code – I’m very out of practice.
function laplaceslider
foo = 0;
bar = 0;
hplot = plot(foo,bar);
h = uicontrol(‘style’,’slider’,’units’,’pixel’,’position’,[0 0 300 20],…
‘min’,-100E-9,’max’,10E-9);
addlistener(h,’ActionEvent’,@(hObject, event) laplace(hObject, event, hplot));
function laplace(hObject,event,hplot)
poreRadius = 7.5E-9;
airWaterTension = 0.07; %in N/m
centerpointY = get(hObject,’Value’);
bubbleRadius = sqrt(centerpointY.^2 + poreRadius.^2);
pasPressure = 2*airWaterTension/bubbleRadius; %bubble radius by LaPlace’s Law
PSIpressure = pasPressure/6894;
if(centerpointY <= 0)
theta = asin(poreRadius/((2*airWaterTension)/pasPressure));
distBubtoLip = sqrt((bubbleRadius).^2 – (poreRadius).^2); %distance from the bubble center to the lip of the capillary
else
theta = (pi) – asin(poreRadius/((2*airWaterTension)/pasPressure));
distBubtoLip = -sqrt((bubbleRadius).^2 – (poreRadius).^2);
end
k=0;
t = pi/2 – theta;
step = (pi/1000);
x = 0;
y = 0;
while t < pi/2 + theta
k = k+1;
x(k) = bubbleRadius*cos(t);
y(k) = bubbleRadius*sin(t) – distBubtoLip;
t = t+step;
end
set(hplot,’xdata’,x,’ydata’,y);
xlim([poreRadius*-2 poreRadius*2])
ylim([poreRadius*-1, poreRadius*3])
axis equal;
pressureText(1) = {‘Pressure in ATM:’;};
pressureText(2) = {num2str(pasPressure*9.87E-6);};
rectangle(‘Position’,[poreRadius*(-1),poreRadius*-1,poreRadius*2,poreRadius],’FaceColor’,’White’);
text(-poreRadius*2/3,-poreRadius*.5, pressureText);
drawnow;