Permeability of NPN vs. Cellulose Triacetate
UPDATE: Some data presented here is out of date. For up-to-date data, see my next post here.
—
Lately I’ve been performing comparison experiments between our NPN membranes (wafer 1132, 3 slot SEPCON, 40-48nm pores and 13-20% porosity) and commercial cellulose triacetate filtration membranes, with respect to the degree to which they hinder the diffusion of various molecules through them. If we can show less resistance to diffusion with our membranes, there exist applications in equilibrium dialysis, and this work also serves to give context to Dean’s hemodialysis experiments.
The basic design of all the experiments has been the same: a solute in tris buffered saline (TBS) is placed in the bottom well of a single-well CytoVu, with blank TBS in the top well. Diffusion is allowed for some amount of time, and then the concentration of solute in both wells is measured. In the case of the cellulose membranes plasma bonding was not an option, so double-sided tape was placed over the gaskets to keep the system together (and the added height accounted for, of course.)
The solutes used were primarily urea and cytochrome C (as a stand-in for beta-2-microglobulin.) I’ll address the cytochrome first, for no particular reason. Due to its size, cytochrome C diffuses slowly and needs to be given ample time to move any appreciable distance. Data was collected at half an hour, one hour, and two hours.
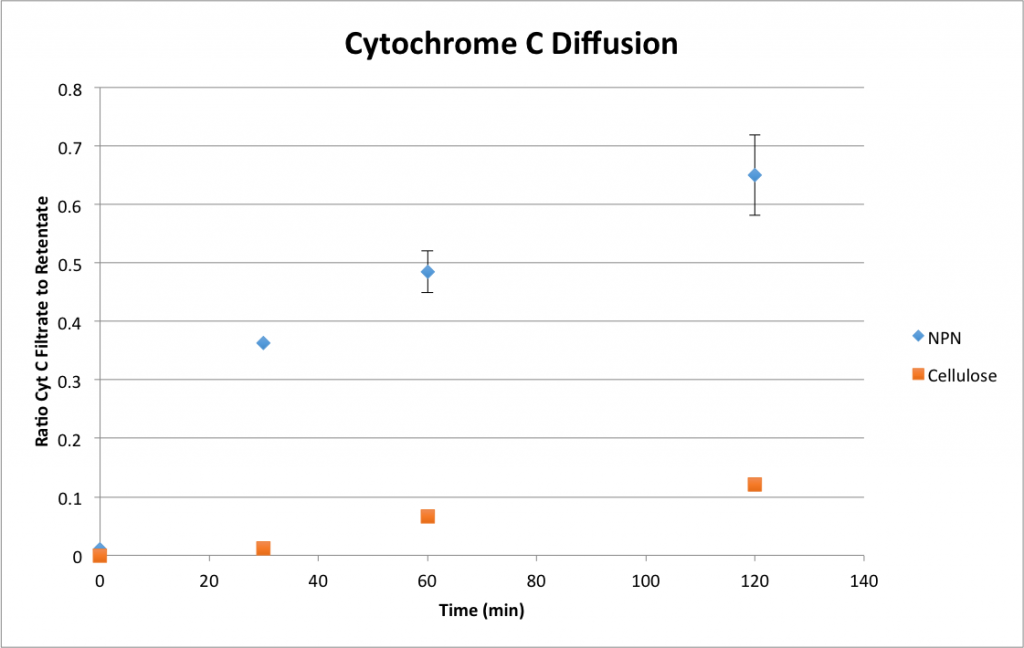
Here, n = 2 for the one and two hour times, and n = 1 at a half hour. The y-axis represents the ratio of cytochrome C in the top well to that in the bottom well; as such, 0 represents no diffusion while 1 represents complete equilibrium. As a qualitative picture, this is useful, and this plot contains sufficient information to predict with reasonable accuracy the time required for any given concentration ratio. However, a more quantitative expression of permeability is even more telling.
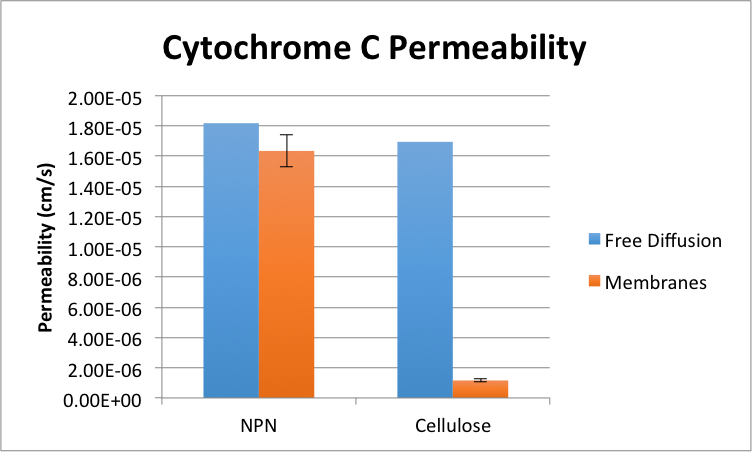
Permeability is calculated here by first determining the effective diffusion constant of cytochrome C in the system according to Fick’s First Law, and then by dividing by the distance between the two wells’ centers. Error is determined by propagation of the error observed between samples intended to be identical. Two different values are presented for free diffusion permeability due to the slight difference between the NPN and cellulose systems with regard to diffusion distance. The take away from this is that NPN presents only a very slight resistance to the diffusion of cytochrome C versus free diffusion of the molecule in water. Cellulose, on the other hand, passes relatively very little cytochrome C.
Next up is urea. This molecule is much smaller and as such diffuses MUCH more quickly, so this experiment took place over the course of just a few minutes.
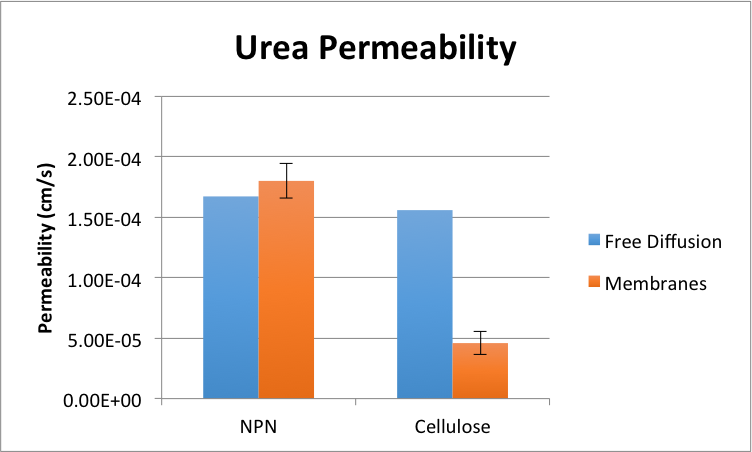
Here, n = 5. At first glance, it would seem that somehow our membranes are passing more urea than would be passed if they weren’t there in the first place. However, under further scrutiny this proves untrue.
First of all, the two are NOT statistically different at alpha = 0.05. Second, the very short timescale of these experiments makes the time it takes me to actually perform the pipetting to sample the wells very important. Since I always sample the bottom well first, urea is still diffusing into the top well during the time it takes me to pipette from the bottom well and into the well plate, replace the pipette tip, and then pipette from the top well. If I assume it takes me, say, six seconds to do this, then the diffusion has actually been going for 3.1 minutes, instead of three. This brings the NPN permeability value down to just marginally above the free diffusion value, and makes the two not statistically different at alpha = 0.15.

Furthermore, since it takes longer to pipette out and into the well plate than it takes to simply pipette in at the start of the experiment, each successive system has been going for longer and longer. This is very difficult to quantify because I’m already rushing to get it all done, but if I assume that on average I’m behind by about 12 seconds for sampling the top wells, then the total time is 3.2 minutes on average. This correction brings the difference between the NPN and free diffusion diffusion constant values down to just 0.9%.
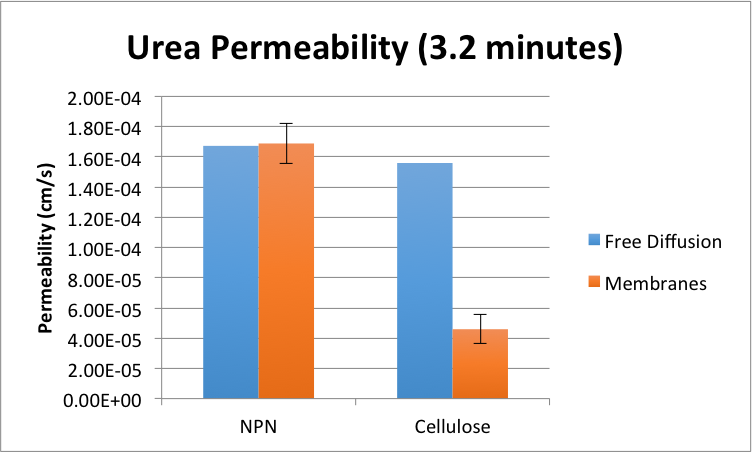
The conclusion here is that for the diffusion of a very small molecule like urea, our membranes provide negligible resistance — as good as water. Cellulose shows a similar trend of decreasing resistance with this smaller molecule, but still hinders diffusion greatly. Thus, the resistance provided by the membrane (ours as well as cellulose) is inversely proportional to the size of the diffusing molecule, which is not a surprising conclusion, but it’s still nice to see it confirmed in the data.
I’ll be performing similar experiments to these with commercial high-flux membranes in the near future. While they’ll surely beat the cellulose triacetate used here, I anticipate that NPN will remain the clear winner.
Please update this post with the pore sizes and porosities of the NPN membranes you used
Added this information to the first paragraph. The data gathered here was with wafer 1132, 13-20% porosity and 40-48 nm pores.