Summary of COMSOL simulations for Endohm TEER measurements
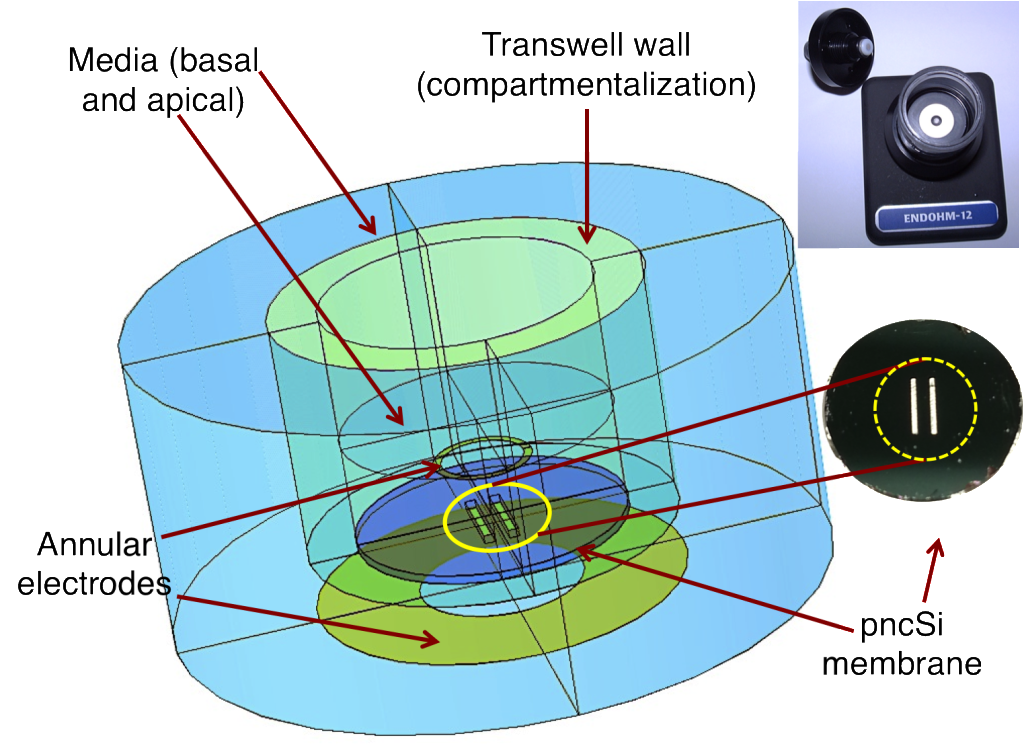
This is the final post (hopefully) summarizing my simulation results I did to model Endohm system. Barrett used endohm cup system to do the coculture of bEnd3 and glial cells for his BBB studies. The resistance values obtained while using pncSi and uniformly porous membrane for cell growth were drastically different, and it was not very well understood how to use the numbers obtained on pncSi. My previous simulations have shown that simple multiplication of resistance with area doesn’t achieve any kind of normalized behavior. So I modeled the endohm system in Comsol to address this issue. Endohm system looks like this.
 The equivalent model in Comsol is as below.
I did my best in making all the necessary assumptions to model this system. The relative distances between and the dimensions of the electrodes, height of the media in top and bottom chambers, material properties are closely approximated to the real ones. I did simulations for 2-slot pncSi material, which Barrett used, as well as for uniformly porous polymer material present in a regular transwell insert. The difference in the geometry of the porous area available for permeation can be appreciated in following two images.

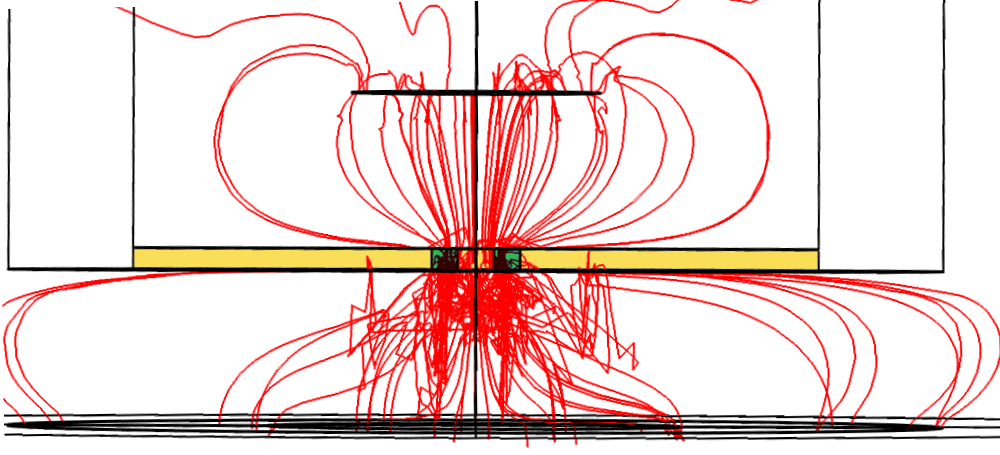
The image on the left shows the uniformly porous membrane, with field lines (almost) uniformly penetrating through the entire cell growth region. The image on the right is for the 2-slot pncSi, with the electric field lines bending around the active area, although the entire area is occupied by the cells. This difference in the electric field distribution makes the analysis for our material quite nonlinear and nonintuitive as well. In general, the resistance values obtained using pncSi is higher than the former material. Simulation results are shown below for different cases.

As we can see, the resistances using pncSi is at least an order or two higher than the values obtained on polymer. I also performed simulations for coculture setup, by creating another layer of cell below active region only (for pncSi membrane), and below entire membrane (for polymer membrane from transwell inserts). Solid lines represent uniculture simulations, while dashed lines indicate coculture. In the inset, I plotted the ratio of resistance values obtained on pncSi to the resistance values on polymer membranes, for both uniculture and coculture. We can understand that as the cells start getting confluent from Day 10 onwards, the ratio also stabilizes. Cellular resistance now dominates over the system resistance, and hence membrane geometry no longer contributes to any further variations (except for the baseline offset). In other words, the two systems can be linearly correlated. This can be also considered as a mapping or correction function; for example if we get R=300 ohms while doing coculture on pncSi system, using the correction factor of 15 (as seen from the inset graph for coculture), the equivalent resistance will be around 20 ohms in a transwell system. Note that this conversion can be done only when we reach the confluence, i.e. the two systems behave linearly. Using this correction function, I corrected Barrett’s values for pncSi system, as shown below.
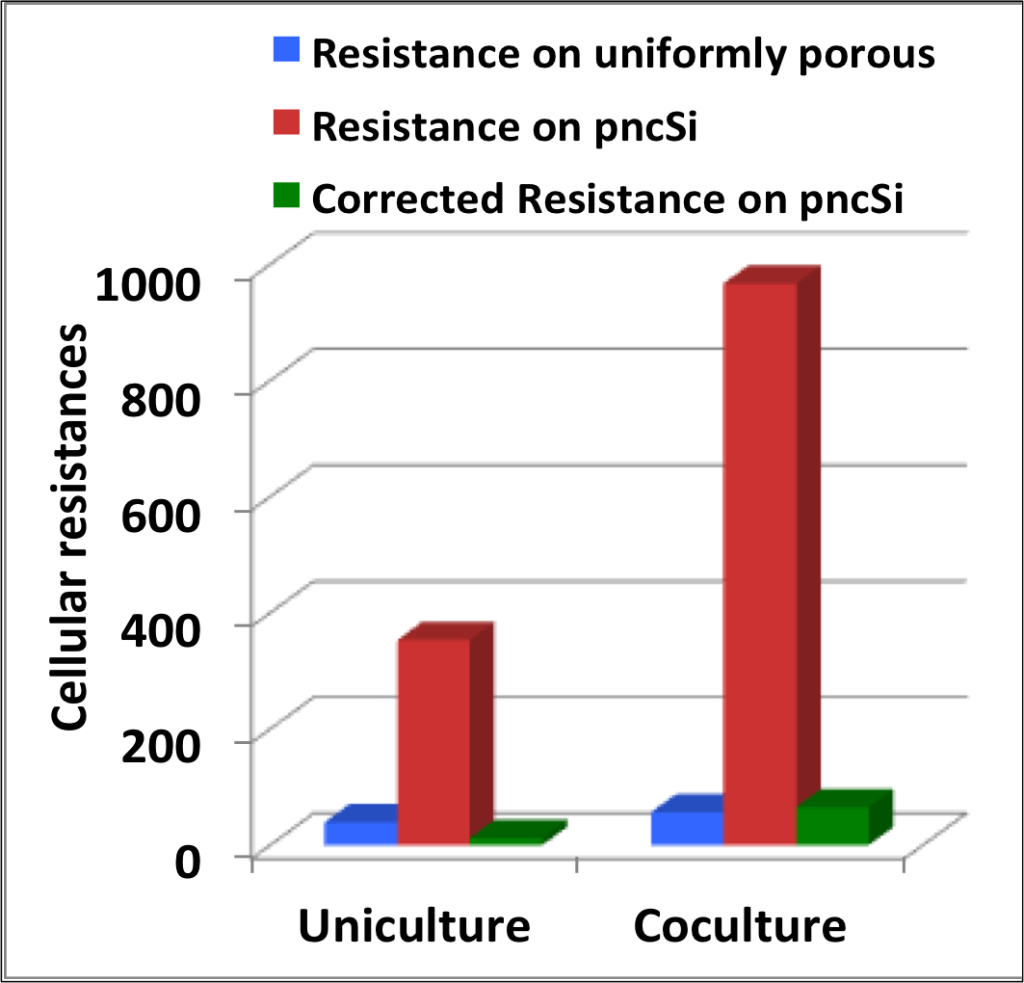
The values shown for each case are the day 14 values only, and not the intermediate ones. After dividing by the correction factor, the resistance values for both system are statistically similar. This exercise can help us in devising correction functions for every microfluidic system we design using our material for cell growth.
You are missing a description of the simulation. It deserves its own post with publication quality figures