Figure drafts for upcoming separations/fouling paper

Figure 1. A) A TEM image of a SiN nanomembrane. Circles with a rim are pores that span the thickness of the membrane, while grey patches are pits in the surface. B) A pore size histogram generated using image processing software shows that the average minor axis (the restricting axis) is ~ 50 nm.
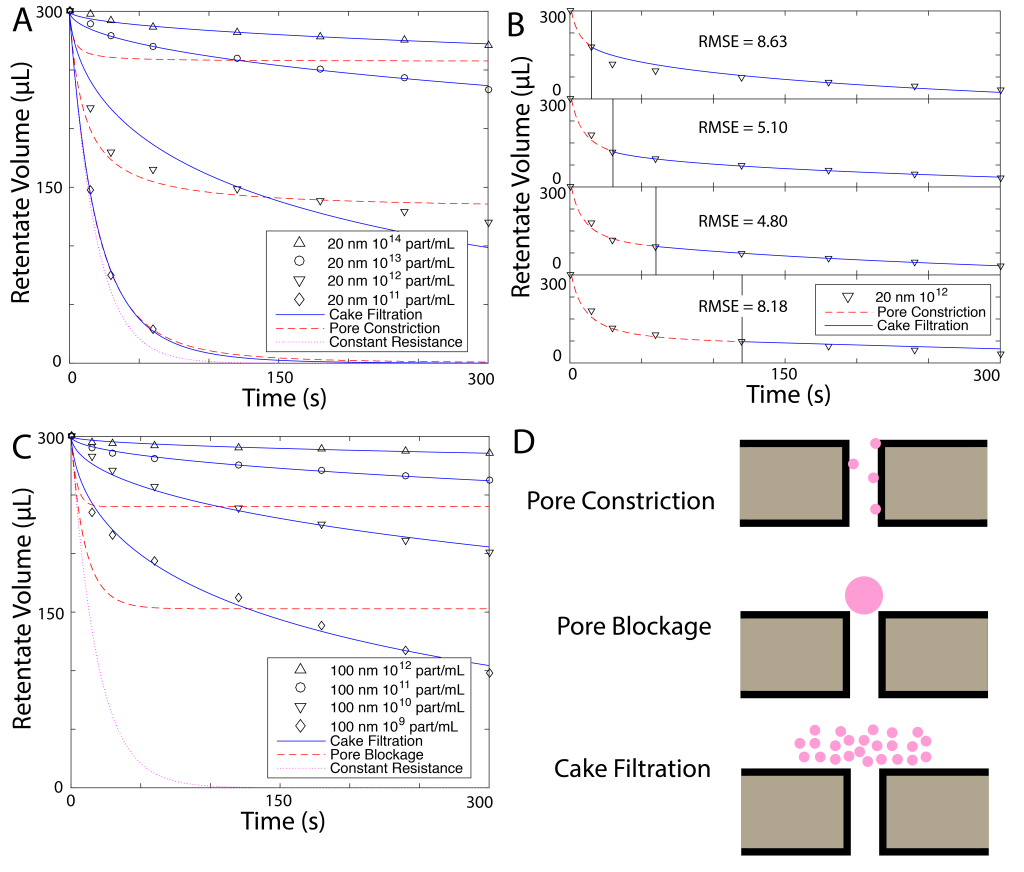
Figure 2. A) A series of filtration experiments performed in a benchtop centrifuge spun at 690 g. Retentate volume versus time of spin was measured for 20 nm fluorescent microspheres at several different concentrations. For high concentrations, the data best fit a model of flux decline based on cake filtration, while lower concentrations seemed better fit by pore constriction. In particular, a transition between the two modes of filtration is apparent at a concentration of 10^12 particles/mL. B) The 20 nm 10^12 curve of 2.A is fit using a pore constriction model for the initial separation, while cake filtration is used for the later part. Several different transition points are chosen, and root mean square errors are calculated for each. Based on these, there is a transition between the two modes at around 60 s. C) Figure 2A is repeated with 100 nm fluorescent microspheres at several different concentrations. Cake filtration seems to dominate separation behavior for all of these concentrations. D) The three flux decline modes are illustrated. Pore blockage necessitates particles bigger than the pores, while pore constriction happens when particles are smaller than the pores. Cake filtration can happen with particles of any size.
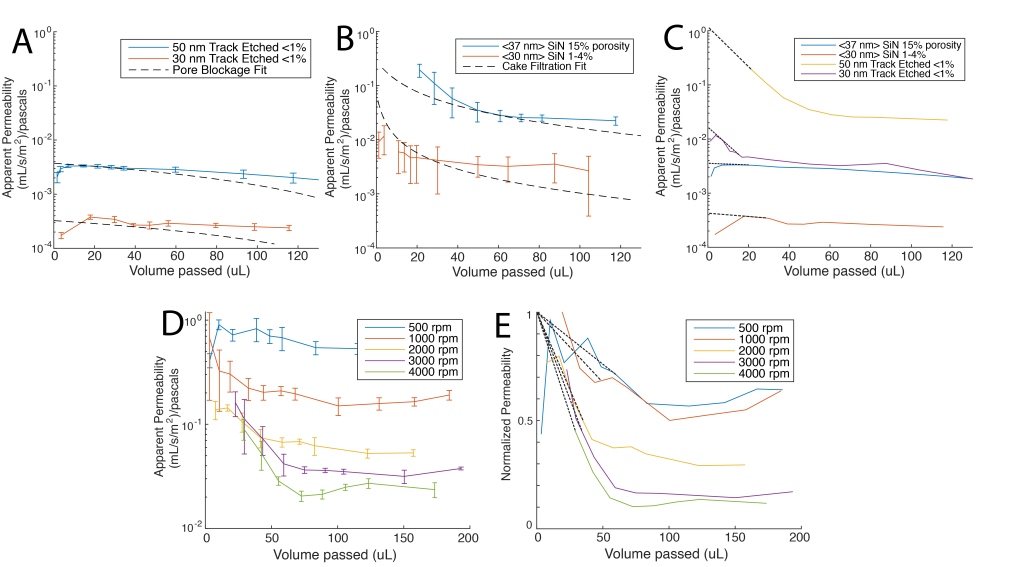
Figure 3. A) Filtrate volume vs apparent permeability graphs for two different track etched membranes with pore sizes of 30 or 50 nm and porosities below 1%. All separations in this figure were perfomed with 20 nm flurospheres at 10^12 particles/mL. Data is fit using the same pore constriction model used in figure 2A. Filtrate volume vs apparent permeability graphs for two different SiN membranes, one with 37 nm average pore size and 15% porosity, the second with 30 nm average pore sizes and a porosity that varied from 1-4% (hence the larger error bars). Data is fit using a cake filtration model. Because of the thinness of the SiN membranes, separations using them happen faster, meaning that more particles build up behind the membrane and causing cake layer formation to dominate the hydraulic permeability, whereas the significantly lower flux of track etched membranes (due to lower porosities and thicker membranes) causes separations to happen slower, leading to higher capacities. C) Capacities for the four membranes are illustrated. D) SiN membranes with 37 nm pore sizes and 15% porosity were spun at several different speeds. As expected, hydraulic permeability was highest at the lowest spin speeds, due to the decreased concentration of particles at the membrane surface. E) Capacity of the membrane at different speeds are shown. Values are normalized by eye.