Affinity Based Capture of Streptavidin Conjugated EVs
Introduction
Proliferation, invasion and metastasis of cancer cells require bidirectional cell-cell communication. Cell-cell communication involves the secretion of oncoproteins, mRNAs, RNAs and DNA fragments by cancer cells. The particles that get secreted by these cancer cells are encapsulated in extracellular vesicles (EVs), which include exosomes. Since evidence suggests that cancer cells secrete more EVs than nonmalignant cells, these particles can be isolated from bodily fluids and serve as biomarkers for cancer diagnosis.
My rotation project consisted of combining Mike and Sam’s diagnostic work. Cancer-cell derived EVs, that should overexpress PD-L1, were used to allow us to streptavidin conjugate EVs using an anti-PD-L1 antibody. Conjugated EVs were infused through the tangential flow for analyte capture (TFAC) method in order to test streptavidin-biotin affinity capture of EVs using clampable devices with micro slit chips.
Methods
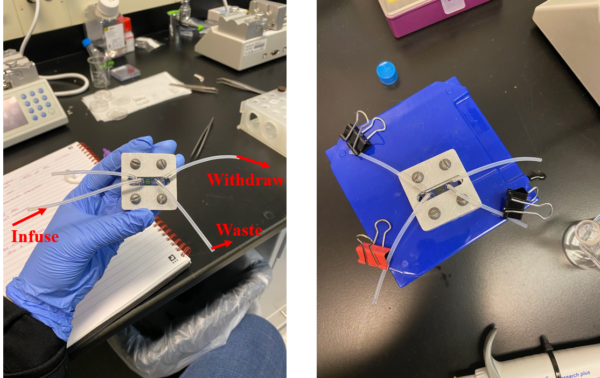
Two experiments were performed, for the first experiment 1 µm slit chips were tested and for second experiment 0.5 µm slit chips were tested. The 0.5 µm and 1 µm slit chips (provided by Mike) were cleaned by submerging them in piranha solution (3:1 ratio of sulfuric acid to hydrogen peroxide) for 30 minutes on a rotary shaker. The chips were then rinsed thoroughly with a wash bottle of DI water. To coat the chips with biotin, a 12.5 µM solution of Kode Biotin (from Kode Biotech) was made using 0.5 ml of 70% ethanol in a centrifuge tube. We placed a chip, one at a time, in the centrifuge tube with the Kode biotin solution and shook delicately for about a minute. After coating, we placed the biotin coated chips in the oven and baked for 1 hour at 70°C. As a control, separate chips were left uncoated and were not cleaned with piranha solution. Clampable devices were then assembled with craft cut silicone gasket layers, as instructed by Sam, with the chip being sandwiched between the stacked layers. The stack was then clamped and sealed creating a complete device for flow. Completed devices are shown in Figure 1 after tubing is inserted into their ports and the device is prewet.
Streptavidin conjugation of PDL-1 was done by following a protocol provided with a streptavidin conjugation kit purchased from abcam. For our experiments we decided to conjugate a 1:5 dilution of our antibody stock in the streptavidin conjugation kit to make ~100 µg/mL solution of streptavidin conjugated antibody. Next, the EVs (provided by Sam) were labeled with CFSE & our streptavidin conjugated antibody. EVs were obtained from the cell culture media of bladder cancer cells (5637 cell line). To prepare an ~105 EV concentration the following steps were followed:
- EVs and CFSE were allowed to thaw.
- EVs were diluted to a concentration of 107 by adding 10 µL of a 109 aliquot to 990 µL of PBS.
- EVs were labeled with CFSE via incubation in a water bath @ 37°C for 20 minutes.
- Streptavidin-conjugated PD-L1 was allowed to warm to room temperature and then added to EV solution to achieve a final concentration of 200 ng/mL.
- EV-antibody solution was mixed on rotisserie at room temperature for 45 minutes.
- To prepare a solution with ~105 EVs/mL, the EV-antibody solution was diluted 1:100 prior to capture.
For the experimental set up, two syringe pumps were needed for infusion and withdrawal of the EVs. Before connecting the clampable device to the syringe pumps, PBS was slowly infused through the device to pre-wet the membrane (shown in Figure 1). After connecting the device to the syringe pump, 1 ml of the EV solution was infused at a rate of 25 µl/min, and a volume of 500 µl at a rate of 12.5 µl/min was set to be withdrawn (settings used for both experiments). The device was unclamped and the chip was removed for imaging.
Results
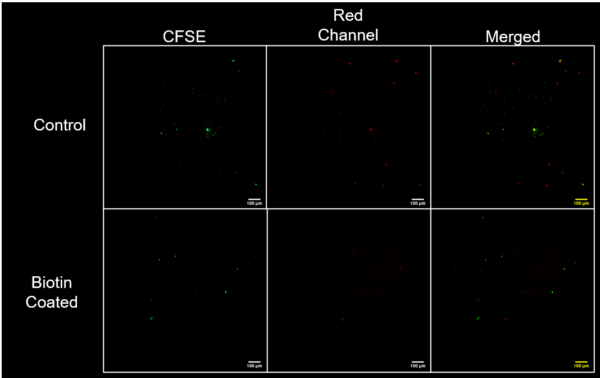
In experiment 1, as shown in Figure 2, EVs were captured with the 1 µm slit chips and we couldn’t see as much capture of CFSE labeled EVs on the biotin coated membrane (Figure 2d) compared to the bare control membrane (Figure 2a). This made us wonder why the control shows more capture than the biotin coated membrane and we think it’s associated with physical capture of aggregates instead of affinity capture of EVs. We also looked at the red channel to see if the green signal was in fact CFSE, the red channel (Figure 2b) showed more particles than the CFSE itself, which might be related to some background signal. The red channel for the biotin coated membrane (Figure 2e) didn’t show much of a signal compared to the CFSE (Figure 2d). Once the channels were merged, the control (Figure 2c) shows that the largest particles colocalize, but not the smallest ones, and in the biotin coated membrane (Figure 2f) there’s no colocalization observed. Therefore, we thought that what we were observing were large aggregates being physically captured on both membranes, with the control showing auto fluorescent debris left over from the gel box.
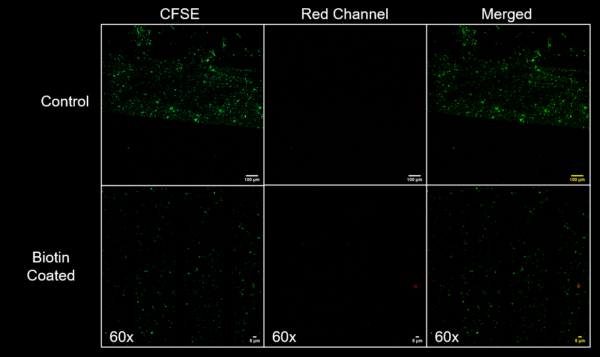
For experiment 2, we decided to change the chip and use 0.5 µm slit chips (Figure 3). EV capture was much more successful as shown in Figure 3a and 3d. In this case, the control (Figure 3a) showed as much capture as in the biotin coated membrane (Figure 3d), but in the control we can observe that there are larger particles than in the biotin coated membrane, which instead shows particles with a similar size to EVs. We associate this to EV aggregates being physically captured in the control and more of an affinity capture on the biotin coated membrane. The red channel was also verified and as shown (Figure 3b, 3e) there’s almost no signal compared to the CFSE on the biotin coated membrane.
Conclusion
In conclusion, the 0.5 µm slit chip was more successful at capturing EVs than the 1 µm slit chip when using the streptavidin-biotin affinity based capture method. The control in the first experiment suggested that the observed particles were physically captured due to the particle size, but the affinity capture wasn’t as successful as we thought. By changing the chip to the 0.5 µm slit, we could address the problem observed in the first experiment. Although, the second experiment did show more EV capture, we aren’t completely sure of why there’s still some particles observed in the control. An explanation to this could be that there’s some physical capture happening instead of an affinity capture due to the size of the particles, since there are aggregates observed. Further experiments would need to address the discrepancy observed in the controls and the streptavidin-biotin capturing methods by repeating the 0.5 µm slit chip experiment with an added prefiltration step.