Normalized Autofluorescence of SiO2 Membranes vs. Track-Etched Membranes
Background: Similar to the Gaborski lab, the authors of the publication “Microfabrication of high-resolution porous membranes for cell culture” fabricated and characterized ultra-thin polymeric membranes for use as cell culture substrates. Upon reviewing their publication, Tom and I discussed some of the experiments that we’d like to replicate to further characterize the SiO2 membrane for our next potential publication. Like our lab, the authors provided evidence that their membranes, fabricated from either Parylene or 1002F, were high-resolution and optically clear for optical microscopy. Another topic that they focused on was their use in fluorescent staining and microscopy. In recognition that fluorescent microscopy is a common, highly practical imaging technique, they stated that it was “important that the cell culture substrate exhibit low autofluorescence in order to limit the level of background noise.”
The authors measured the autofluorescence of the Parylene HT and 1002F membranes in the three common fluorescence channels (DAPI, FITC, and TRITC). The results were compared to the autofluorescence of commercial cell culture substrates fabricated from polycarbonate (PC), polystyrene (PS), polyethylene terephalate (PET). PET is commonly found in the commercial Greiner Track-Etched hanging membranes, which are also used in the Gaborski Lab.
The results of their experiment can be found in the three graphs below. The Parylene HT and 1002F membranes exhibit low autofluorescence. The intensity values were normalized to the autofluorescence of a glass slide.

Methods:
To mimic their experiment, we conducted autofluorescence experiments using the following cell culture substrates in triplicate:
- 3.0um low porosity (5.7% porous) SiO2 membranes
- Non-porous SiO2 membranes
- Greiner 3.0um Transparent (low porosity, 4.2% porous) Track-Etched hanging membrane inserts
- Greiner 3.0um Translucent (high porosity, 22.7% porous) Track-Etched hanging membrane inserts
- TCP was used as a control
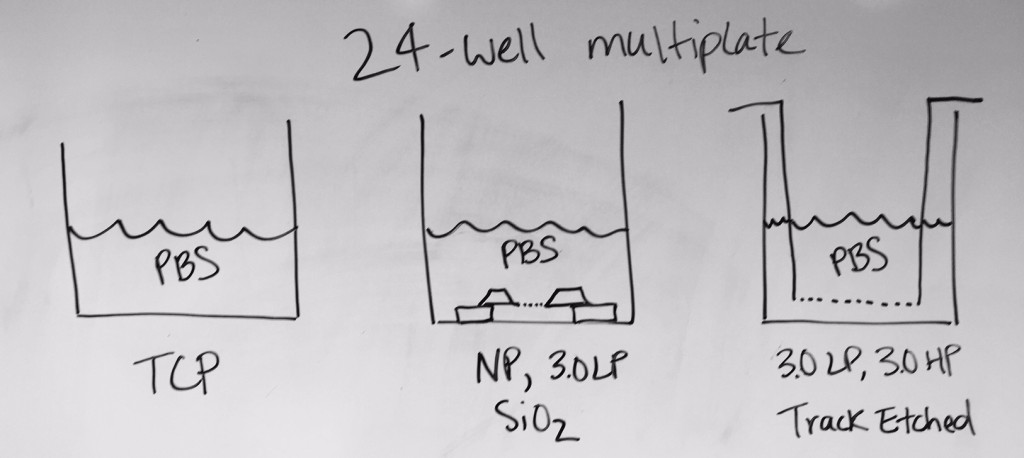
The following image is a schematic of each of the substrates in a well of a 24-well TCP plate, with each well flooded with 800uL of 1x PBS :
The substrates were imaged in the three common fluorescence channels, DAPI, FITC, and TRITC, as well as in phase contrast to ensure that the substrate was free of debris and in proper focus. Three images were taken of each substrate, totaling to a sample size of n=9 for each condition. The images were imported into ImageJ for analysis. Using the rectangular selection tool, a 200×200 pixel square was outlined in each image. The measuring tool was used to quantify the mean grey value (intensity) within each square. Each intensity value was normalized using the average autofluorescent intensity of TCP as a baseline. Average intensity values and standard deviations were calculated using the normalized values for each DAPI, FITC, and TRITC channel for each substrate.
Results:
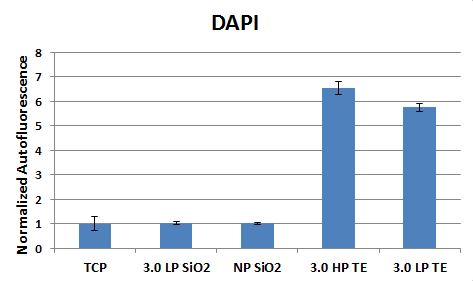
The 3.0um LP and non-porous SiO2 membranes exhibited low autofluorescence that was nearly identical to the TCP autofluorescence. The autofluorescence of the 3.0um HP and 3.0um LP Track-Etched membranes exhibited high autofluorescence. The track-etched membranes are statistically different from TCP and the SiO2 membranes. They are also statistically different from one another. p-values <0.01.
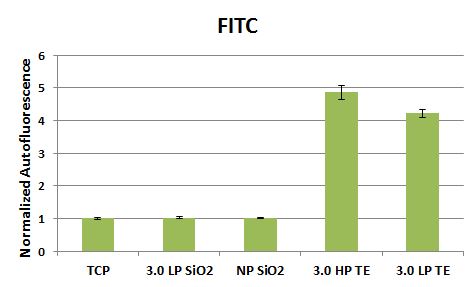
Similar to the DAPI results, in the FITC channel the 3.0um LP and non-porous SiO2 membranes exhibited low autofluorescence that was nearly identical to the TCP autofluorescence. The track-etched membranes are statistically different from TCP and the SiO2 membranes. They are also statistically different from one another. p-values <0.01.
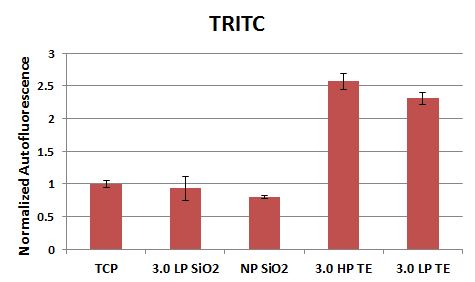
Interestingly, in the TRITC channel the autofluorescence of 3.0um LP and non-porous SiO2 membranes were actually lower than the TCP autofluorescence. NP SiO2 membranes are also different from TCP. p-values <0.01. The autofluorescence of the 3.0um HP and 3.0um LP Track-Etched membranes exhibited high autofluorescence. The track-etched membranes are statistically different from TCP and the SiO2 membranes. They are also statistically different from one another.
Interesting stuff. It’s worth noting that the filter sets you’re using are optimised for the Stokes shift associated with standard fluorophores, and that autofluorescence quite commonly extends rather further to the right. You could try removing the emission filter from each of the filter cubes, thus extending the acceptance bandwidth, and see whether there is anything interesting going on in the longer wavelengths. To be truly quantitative it would be a good idea to scan the same samples on a spectrophotometer which would give you a curve across the spectrum rather than a single value to compare.