Effect of Membrane Morphology on System Capacity During Normal Flow Microfiltration (review)
This paper tackles the concept of membrane capacity – the amount of fluid a membrane can pass before it’s flux declines (due to pore blockage or the buildup of a cake) to some arbitrary fraction of the initial flux. Common practice in industry (according to the paper) is to calculate capacity as the volume passed before flux drops to 10% or 20% of the initial flux. Capacity is an important number for the design and maintenance of ultrafiltration systems. It’s also an interesting basis of comparison between membranes of different types – in the NPN separations paper I’m currently working on with Josh Winans I’m comparing the capacities of track etched (TE) membranes to NPN to see if the higher internal surface area of TE means generally lower capacities.
Common practice in industry now is to find the flux decline behavior at the beginning of a separation, and extrapolate from this based on the well understood models of pore-blockage to get a capacity number. Zydney and Ho have previously found that this analysis is lacking, and found better agreement with a model that described flux decline using both pore blockage and cake filtration, which is also something that I’ve been looking at in Josh’s NPN separations paper (although their treatment is more complicated than the one I’ve been using). But even this advanced model is inadequate for spongy-type membranes with interconnected pores, because spongy membranes enjoy a slight permeability boost at the beginning of filtration experiments compared to cylindrical pore membranes (which includes both TE and NPN membranes).
What’s interesting is that this paper finds exactly the opposite relationship of internal surface area to capacity as the one I’m nailing down in Josh’s paper, although the two conclusions aren’t incompatible.
The heart of this paper is in the schematic illustration in figure 1.

because polycarbonate track etched (PCTE membranes) are made of lots of long cylinders (that don’t share fluid), when a cylinder is blocked by a protein aggregate that’s all there is to it. A blocked cylinder is a straightforward decrease in active area. But when cross-linked spongy membranes (PVDF) accumulate a protein aggregate, fluid is kept from the membrane for a small penetration depth, but then lateral movement of fluid means that the portion of the membrane below the blockage is still contributing to the permeability of the membrane. This is demonstrated below:
Note that the pressures used in these experiments were chosen so that all three curves had the same initial flux, and all three were in the range of 0.8-2 PSI. PCTE membranes had a pore size of 200 nm.
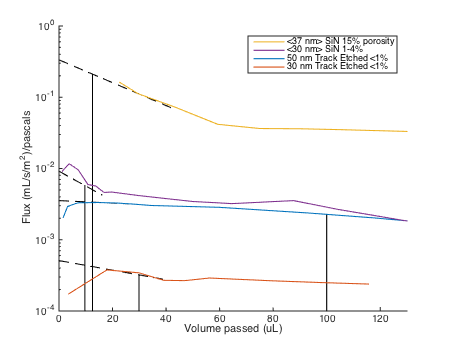
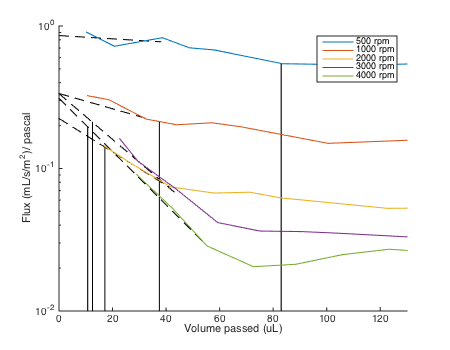
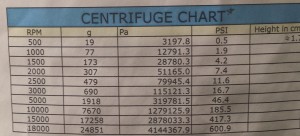
For comparison, here are experiments I’ve been doing in the centrifuge with 50 and 30 nm TE membranes, as well as two different SiN membranes. 500 rpm corresponds to 0.5 PSI and 1000 rpm to 1.9 PSI.
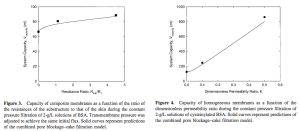
The next chart, figure 3, was counterintuitive to me. They found the capacity of three different configurations of membranes – 1 TE membrane, 1 TE membrane on top of a spongy membrane, and 1 TE membrane on top of 4 spongy membranes. Pressure was adjusted for each experiment so that the initial flux was the same (so the 5 membrane configuration presumably had a much much higher driving pressure than the solo TE membrane). Capacity is higher with more spongy membranes, because the “spongy-ness” begins to dominate the separation behavior of the membrane. A similar dataset is plotted in figure 4, but with the x axis being a measure of the ability of fluid to move laterally through three different types of membranes (cleverly, they measured the ability of fluid to move laterally through the membranes by doing flux experiments with membranes partially obscured by tape).
In figure 5, they replot figure 2 with fit lines generated with the industry-standard pore-blockage model. They note that the model isn’t terrible for the TE membranes, but it does quite poorly for spongy membranes.

They summarize how much better a model incorporating lateral flow and cake buildup works in this table:

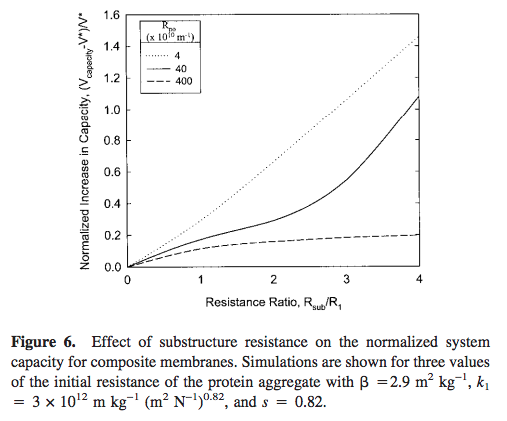
The final figure uses this model to predict that as the initial resistance of the protein layer grows (as the behavior of the flux declines moves from pore-blockage-like (….) to cake-filtration-like (- – – – – -) ) the advantage we get from being sponge-like diminishes, because lateral movement in the membrane doesn’t help much if all the resistance in the system is coming from a protein cake above the membrane.