ECMO Experimental Design
As I’m approaching the end of my time here at UofR, there’s one last thing I’d like to fit into my thesis: experimental validation of the ECMO model. In this post I’m going to describe the experimental design, and in a future post I’ll discuss the model in more detail (pending a more complete set of conclusions.) This post will not contain any experimental results — those will come later, possibly with the discussion of the model.
The purpose of this experiment is to evaluate the change in oxygenation of a solution of hemoglobin across a single pass over a membrane with pure oxygen on the other side. Simple enough — however, the biggest constraint is the fact that a hemoglobin solution exposed to atmosphere oxygenates to saturation very rapidly! Therefore, every step of the experiment needs to take place in a highly-controlled environment containing vacuum or some non-reactive gas such as nitrogen.
The system I’ve designed contains five major components: a deoxygenation chamber, a syringe w/ pump, a pre-ECMO sample collection tube, the membrane device, and a post-ECMO sample collection tube. These are indicated in the photo below and will each be described in detail.
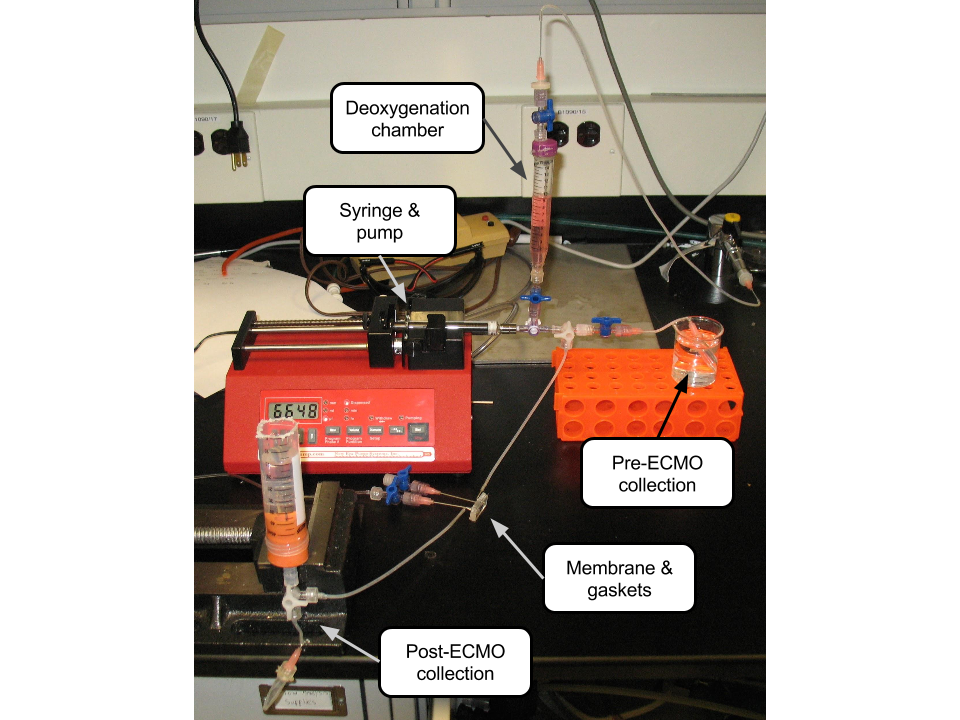
Deoxygenation chamber: The first step in the experiment involves the deoxygenation of the hemoglobin solution via vacuum. The solution is allowed to sit under vacuum for as long as it takes for bubbles to stop evolving out of it, something like half an hour to an hour. The chamber is constructed from a 15 mL centrifuge tube with holes drilled into either end for luer fittings and sealed with hot glue to ensure air-tightness. Leaks in this device are obvious — a constant stream of bubbles from the leak site can be observed.

Syringe w/ pump: The active component of this device is a syringe controlled by a single syringe pump. The desired flow rate for this system when pumping through the device is 36 uL/min, so the primary considerations when selecting a syringe are inner diameter (if it’s too large, the pump will not be able to create an even flow at such a low flow rate) and gas-tightness. Of the BD syringes we keep in the lab, the 1 and 5 mL are not gas-tight, while the 60 mL is but is too wide. Thus, I ordered a gas-tight 5 mL glass syringe from Hamilton. This thing is of really high quality, so it’ll be good for reuse in similarly difficult applications.

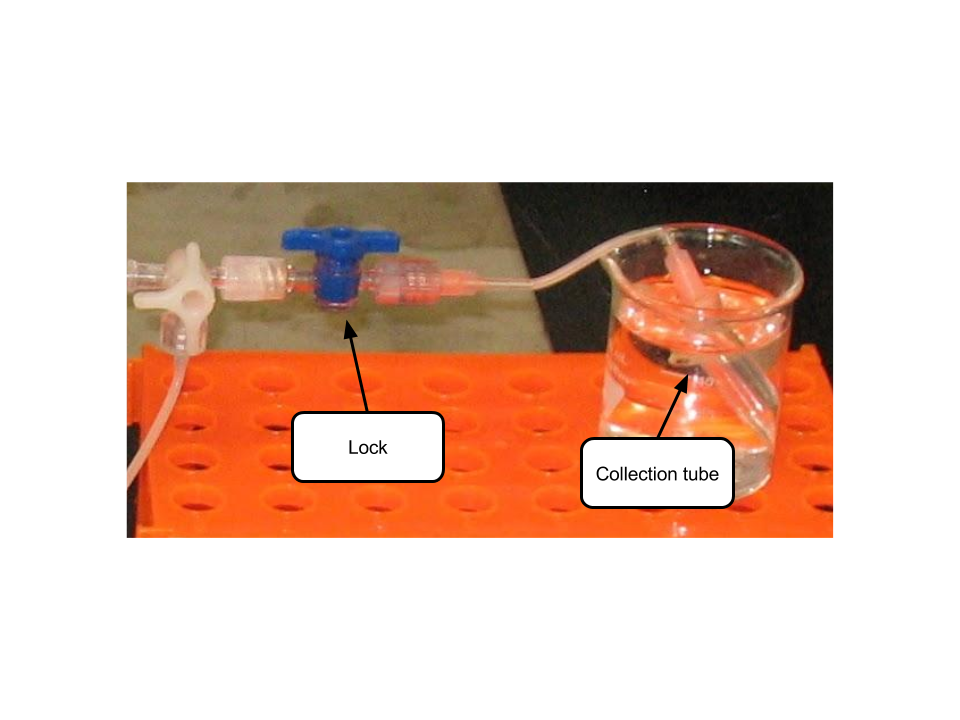
Pre-ECMO collection: In order to know how much oxygenation occurs during the experiment, we need to know how much oxygenation was present initially. The pre-ECMO collection chamber consists of an 0.5 mL centrifuge tube sealed to a luer fitting with hot glue, just as in the deoxygenation chamber. Because fluid needs to be pushed into this tube without taking anything out, I wanted to evacuate this chamber at the start of the experiment to avoid super high pressures which could potentially force it open and ruin the experiment. However, simply evacuating it leaves it prone to leaking air into the system. I fixed this issue by suspending the tube in water, which due to surface tension is unable to leak inside through any very tiny cracks.
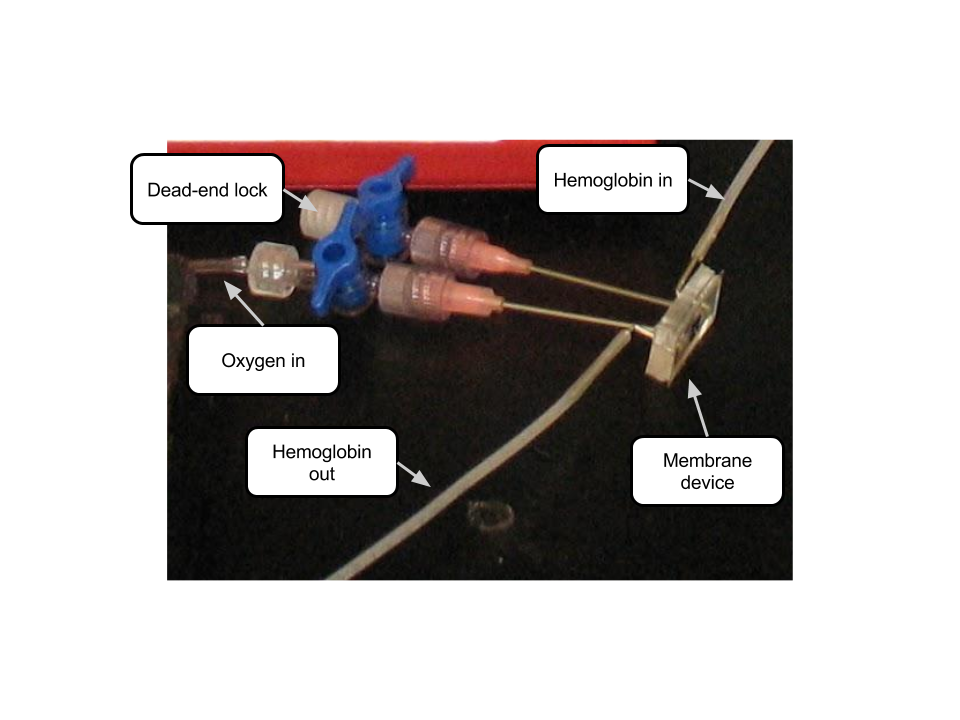
Membrane device: The membrane is contained within the same device I used for my hemodialysis work, designed by Henry. The hemoglobin solution channel is rectangular, 0.3 mm tall and 1 mm wide. On the other side of the membrane, a constant pressure of pure oxygen gas is supplied, controlled by a regulator that is not shown. The outlet from this side of the membrane is blocked with a luer lock to seal it.
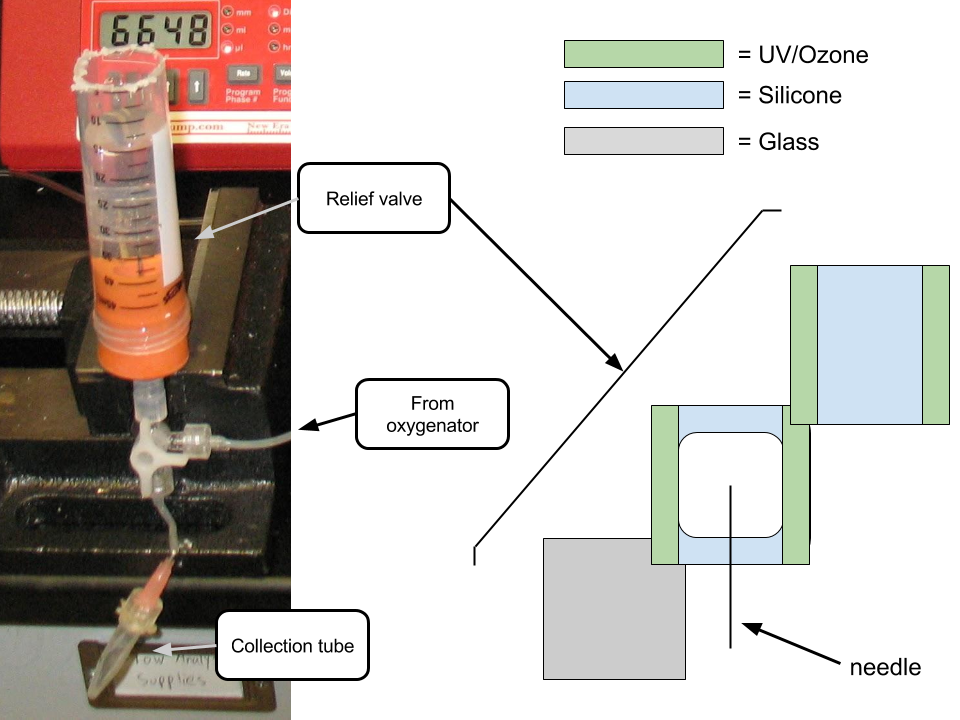
Post-ECMO collection: The last step is to collect the (hopefully) now-oxygented solution for measurement. A similar tube setup is used in this case for collection — however, this tube cannot be evacuated before the experiment because the vacuum would pull on the solution as it flowed through the membrane device and change the flow rate. Instead, my approach here for avoiding large pressure build-up is a one-way relief valve. The valve consists of a needle penetrating into a silicon chamber bounded on one side by glass and the other by another piece of silicon. The pieces of silicon are UV/Ozone bonded together on just two edges, as shown in the image. In this way, when pressure builds up inside the chamber (due to the syringe pushing fluid into the system, for instance) the silicon pieces are pushed apart and gas can escape; however, when pressure is low in the chamber the silicon is pulled together and atmospheric gas cannot enter the system. This valve is suspended in water for the same reasons as the pre-ECMO collection tube, and works stupendously well (I’m quite proud!)
These experiments are forthcoming, but I’m hoping to have some good data by next week.
The last thing to discuss is the method I’m using for quantifying oxygenation. The change between oxygenated and deoxygenated hemoglobin that I want to take advantage of for this assay is the shape of the absorbance spectrum in the 500-600 nm range:
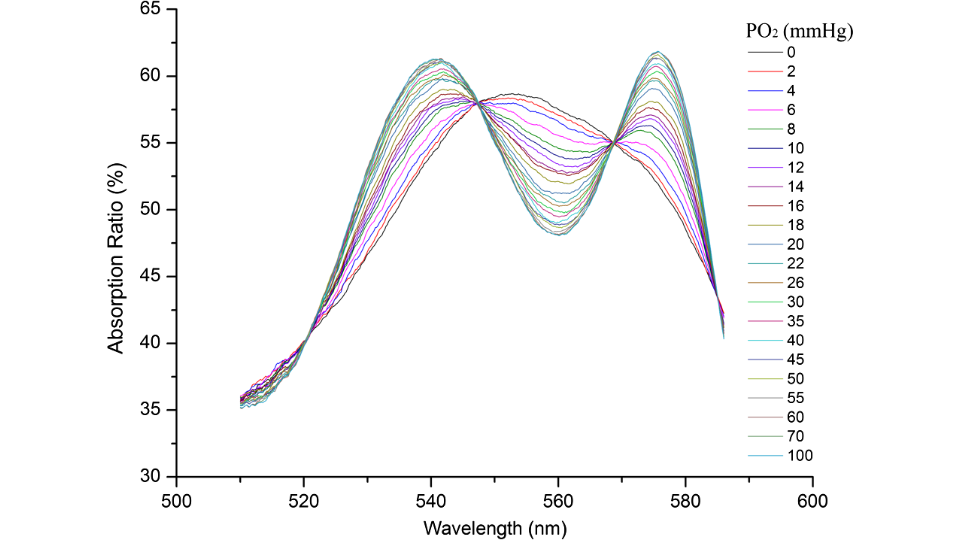
These data are from Liu et al. [1]. I chose to look specifically at the slope at the point where all the lines come together at about 568 nm, and created a set of data for the relationship between this slope and the oxygen pressure using this figure. I then used the equation provided by Aberman et al. [2] to translate oxygen pressure into hemoglobin saturation percentage, resulting in the following figure:
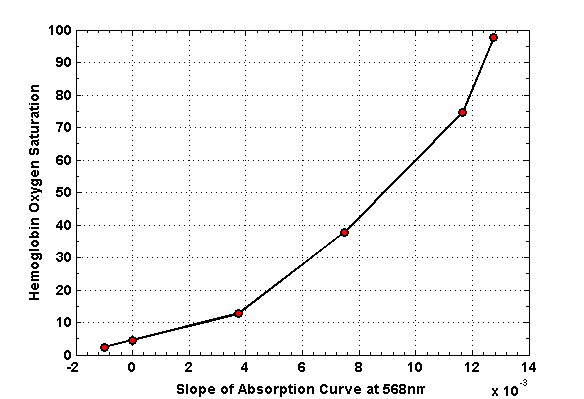
This plot is the foundation of my assay. I’ll record the slope of the spectrum at 568 nm, and read off the saturation percentage from there. Preliminary results indicate that “deoxygenated” solution prepared using the method I described above is somewhere around 8% saturated, compared to 100% for the same solution exposed to atmosphere.
[1]: Liu et al. “Specific absorption spectra of hemoglobin at different PO2 levels: potential noninvasive method to detect PO2 in tissues.” 2012. Journal of Biomedical Optics 17(12).
[2]: Aberman et al. “An equation for the oxygen hemoglobin dissociation curve.” 1973. Journal of Applied Physiology 35(4).