Microfluidic Capacitors and Efficiency Measurements
The laboratory has been using our Langer peristaltic pumps for flow experiments in devices with saturated cell culture. A problem we’ve been having with microporous membranes was the shearing of the cells off it, which was attributed to the deflection caused by the pulsing of the pump.
So we decided to mount the capacitors to eliminate the peaks of pressure on the membrane and avoid deflection.
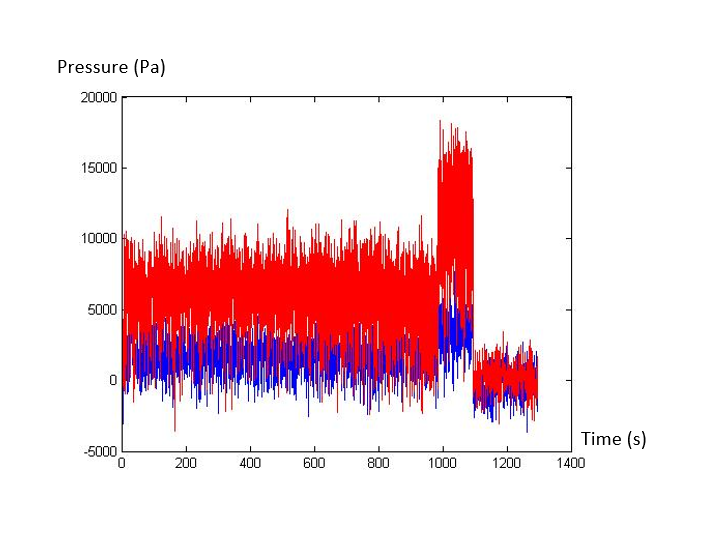
I have tested a few different models for the capacitors, but I will expose here only my best results. The following data was taken with the uProcess software and LabSmith pressure sensors. The circuit here was composed just by the tubing, pump and capacitor. The blue line represents the pressure before the capacitor and the red line represents the flow after it:
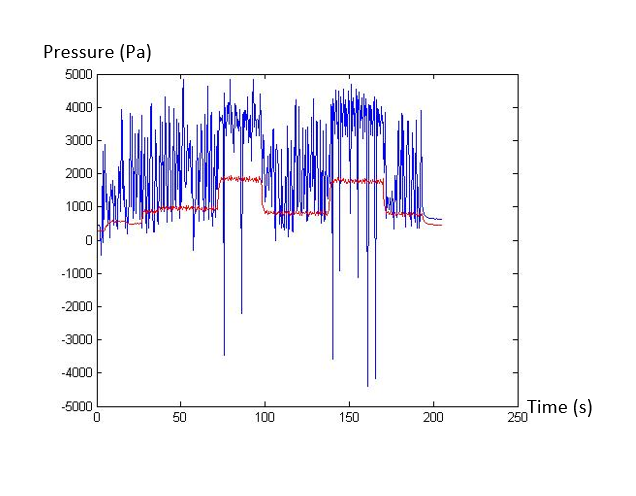
The dimensions for my capacitor were: Membrane: 50um; Volume: 0.315cm3; Bubble Trap Layer: 300um.
Both models yielded really satisfactory results, but Tejas’ capacitor proved to be better. So from this point on, the testing for membrane deflection were made with this capacitor. And the liquid used was ethanol, with flux of 1ml/min.
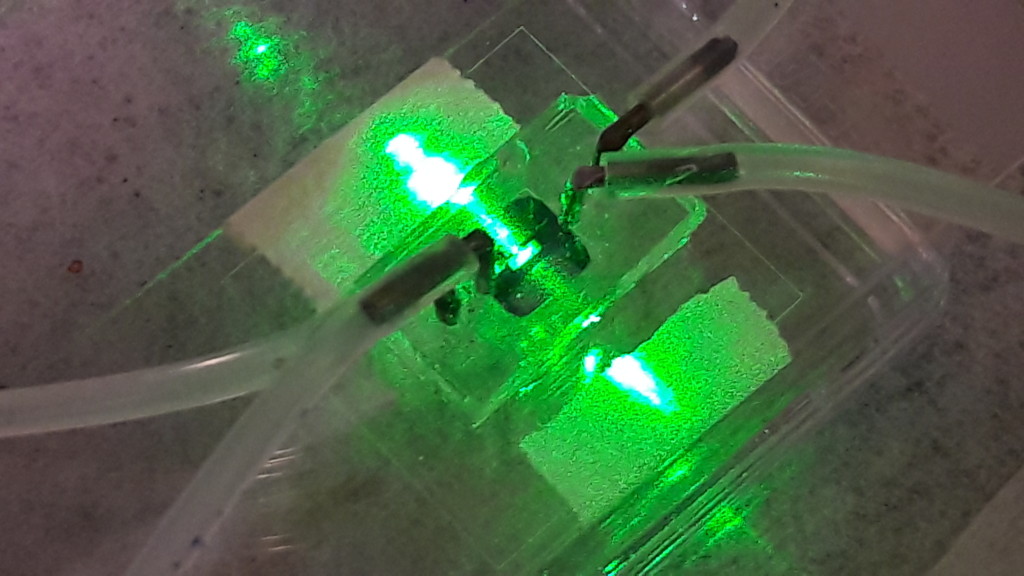
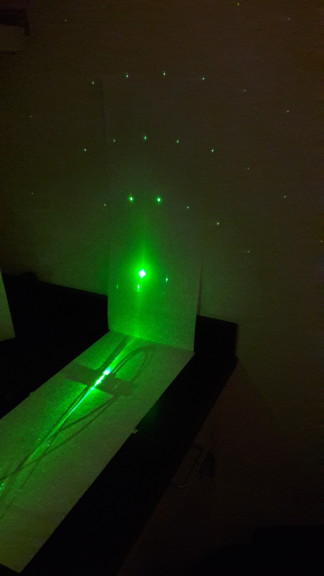
The method for measuring the deflection was proposed by Jim, and it relies on the diffraction pattern of the nanomembrane (microporous) that appears when illuminated by a laser pointer. Firstly, to visualize the deflection directly I took a video of it through the microscope. Note that the big dark spot is a bubble.
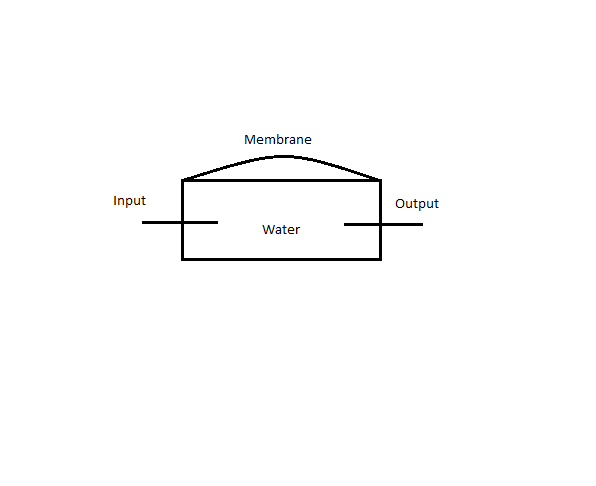
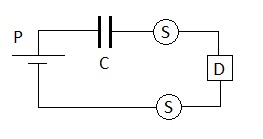
The circuit I used for the experiment is shown below:
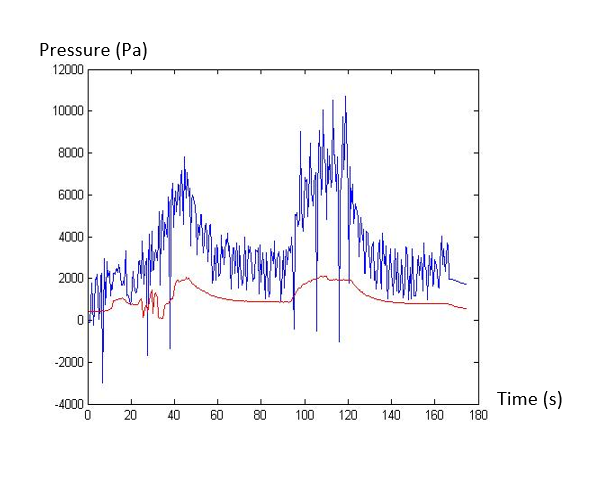
The graph below shows the pressure plot without the capacitor, and how the membrane itself functions as a damping element.
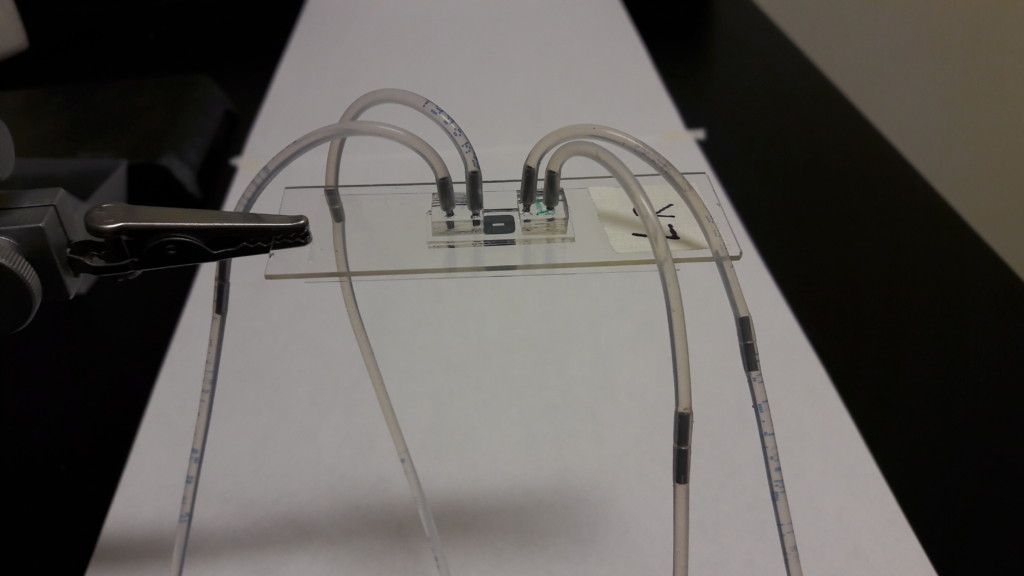
The first device I used was the original model from Tejas, which contained 4 layers of gaskets, including the one that houses the chip; top and bottom channels (1mm in width) and a sealing layer just above the bottom channel. They were all 300um thick. On top of them, a PDMS block covered the entire area to support the needles for the flow.
This PDMS block that covered the chip on top created too much noise to identify the speckle pattern, so I had to redesign the device. I used longer flow channels to provide enough space between the needles so that two blocks of PDMS were not connected to each other, but still supported the needles. Also, I drilled holes for them on a glass slit (1mm thick) to seal the top channel. This will decrease the noise enough to create the diffraction pattern.
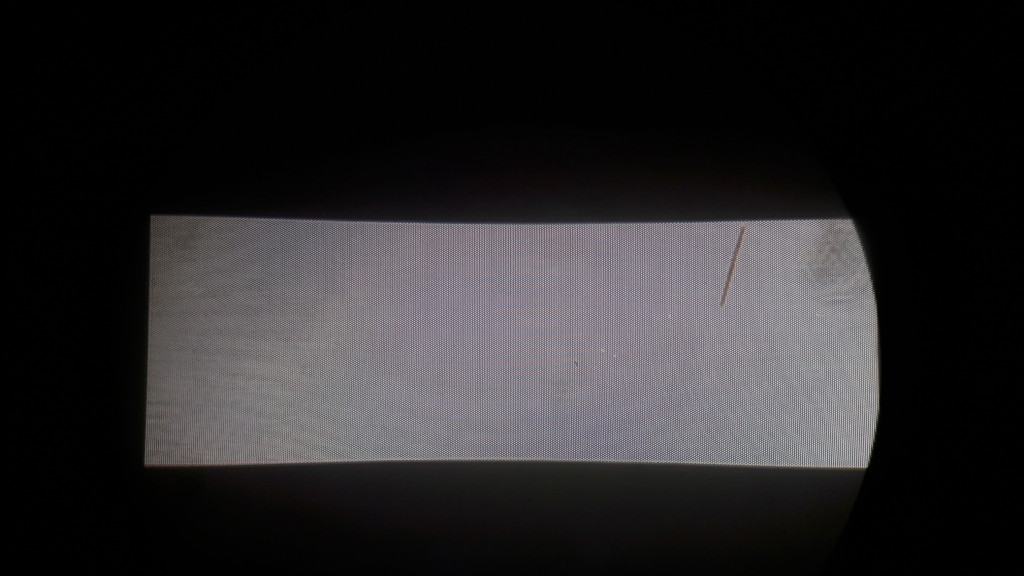

Membrane before and after the flow.
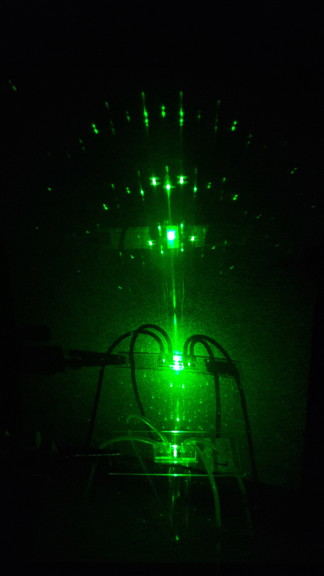
Interestingly, the dots do not pulse with the flow. So I managed to direct the beam onto the membrane where I got reasonable noise. One way to do this is by letting the glass get dirty and not cleaning it, or adjusting the angle of the laser relative to the membrane, so that it hits the gaskets more.
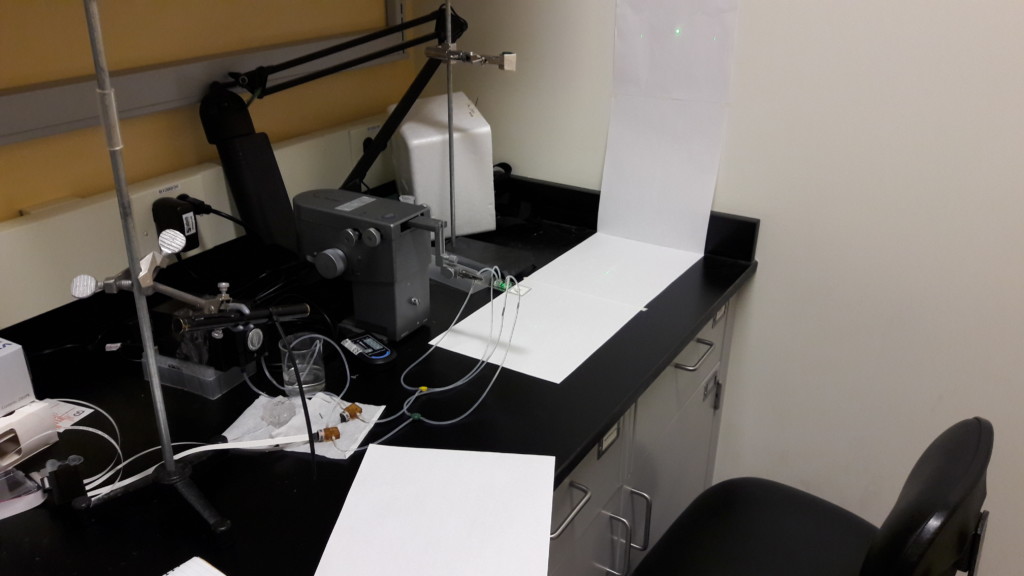
But the most interesting pattern that pulses with the flow is the shadow of the device on the table.
I changed the position of the device and laser to get the transmission pattern of the membrane on the lab’s floor, to get a better magnification of the pulses. The first video is the membrane under high flow and the second is high flow with the capacitor.
With increased flow, the pulsing gets faster, but the amplitude is not exactly proportional. Its behavior is more chaotic, as shown in the first plots, and is hard to see with the naked eye. The pulsing goes away completely when the capacitor is inserted, so it is safe to assume that the deflection is minimized as much as possible, if not totally eliminated. One thing that caught my eye was the shaking of the small dots, when there is no pulsation. I can’t say if its either the mount of the laser or the membrane, because it does not follow the frequency of the pump. Nonetheless, this is a very good indicator of the capacitor’s efficiency.
Now, the next step is to reproduce this experiment with a more controlled procedure to quantify and calibrate the measurements. The goal is to be able to relate the dislocation of the light onto a screen to a precise value of the deflection of the membrane. A possible, but very sophisticated, way to do this is by using an AFM tip to pull and push the membrane in the desired quantity and evaluate the effect on the distortion of the image.