Morphology evolution in pnc-Si membrane
In this post, I would like to sum up all different annealing scenarios, which corresponding to different morphologies of the pnc-Si membrane so far we have observed. It should be very helpful to understand the evolution of the pore formation during the annealing. This whole evolution I believe, not only applies to the oxide/silicon/oxide stack, but also the nitride/silicon/nitride stack even though the transition temperature may be different for those two systems. All the temperature in this post is from the results of oxide/silicon/oxide stack. The following scenarios are arranged by the annealing temperature from low to high.
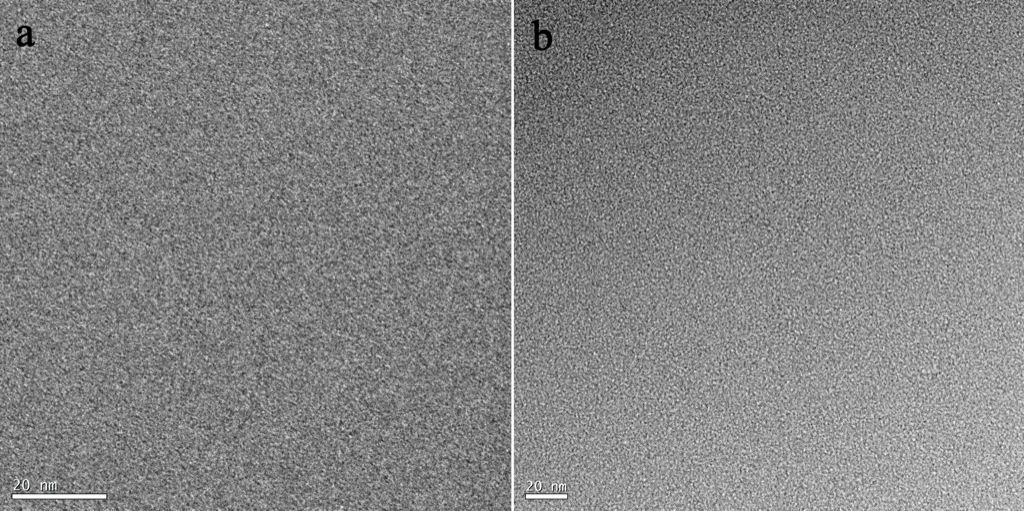
Scenario 1. Very low temperature annealing. In this case, the annealing temperature is below 600C. No difference is observed in the morphology from TEM image before and after annealing. In the following images, (a) is the TEM image of unannealed membrane and (b) is the membrane annealed at 500C for 5 minutes. Basically the temperature is not high enough to crystallize the amorphous silicon layer thus the TEM images look very similar in terms of the morphology.
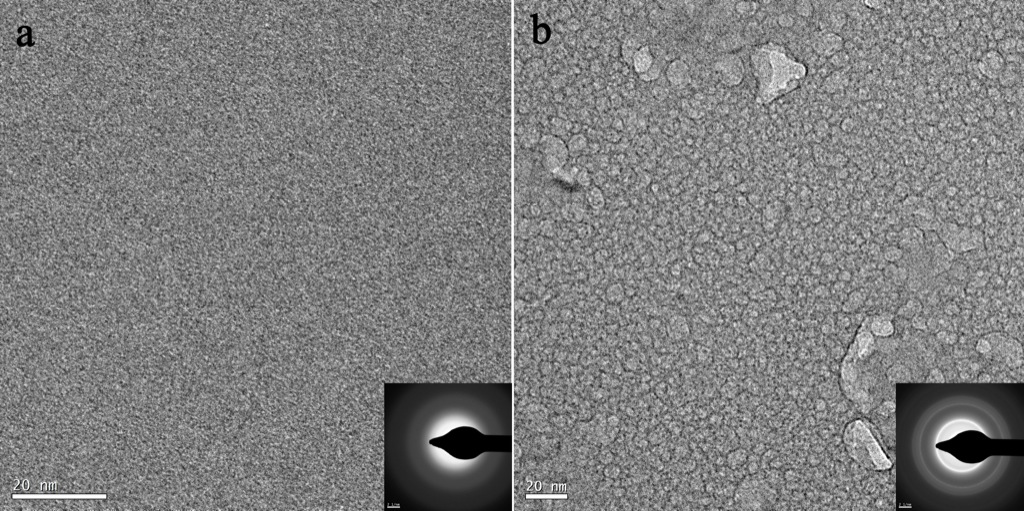
Scenario 2. Amorphization after annealing. In this case the annealing temperature is around 650C. With the help of in-situ TEM we observe that pores as well as the silicon crystals are formed and pores are moving around, coalesce during the annealing. However silicon crystals reamorphize and through pores seem to close and leave with pits morphology after cooling down to room temperature (see following images). Image (a) is the initial membrane and (b) is the membrane annealed at 650C for 5 minutes. It can be clear seen that the morphologies of two membrane are quite different in which ‘honeycomb’ or ‘pits’ feature is observed from image (b) where image (a) is more likely featureless. However, no clear through pores and crystals are able to be observed in the image (b). The diffraction image of image (b) proves that the silicon film shows amorphous state after cooling even though it was polycrystal during annealing.

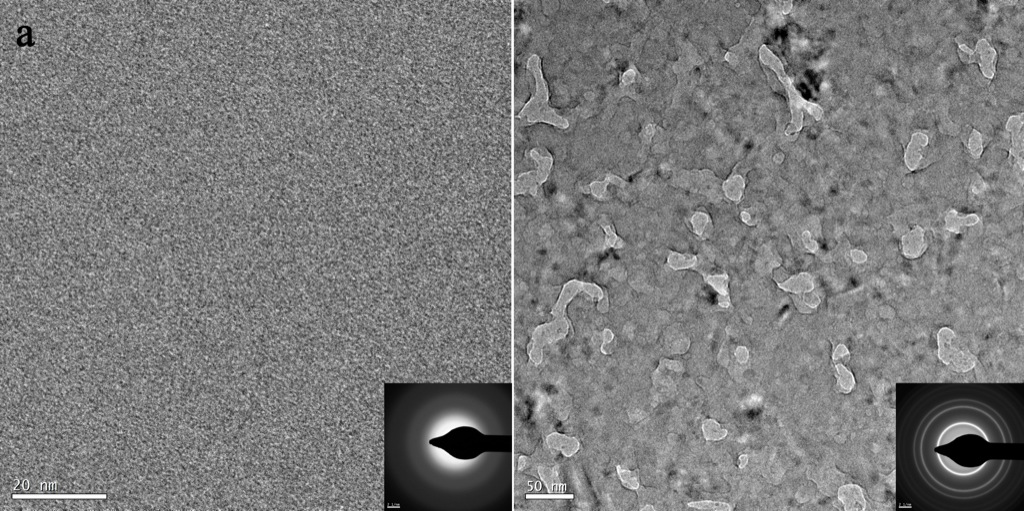
Scenario 3. Few crystals and through pores survive after annealing. This case happens when the annealing temperature is slightly higher than that of scenario 2, which is around 680C. See following images. From the TEM images it can be seen that some through pores as well as crystals survive in the membrane after annealing. However the major feature is still the amorphous pits feature. The diffraction image is different from the scenario 2 since ordered crystal rings already can be seen even though it is a little dim. The shape of survived pores is irregular, somewhat elongated. This may be because that larger irregular pores which are formed by coalitions of small pores during annealing survived after cooling down.
Scenario 4. Irregular pores and Si nanocrystals. In this case, the membrane is annealed around 700C. From the following TEM images it can be seen that elongated pores with irregular shape are formed after annealing. The amorphous pits base is replaced with silicon nanorystals. The diffraction image also clear shows the polysilicon crystal ring feature. Compared with the scenario 3, the biggest difference is the silicon nanocrystal percentage. Basically we can understand this scenario as the following. More pores are formed during the annealing since more amorphous silicon crystallizes with this slight higher temperature. However, the silicon film is still not fully crystallized and pores are still able to move around and coalesce to form big but irregular shapes during annealing. Recall the video of pore movement that the moving is stopped once the pore touches the silicon crystal. So lots of big but irregular pores are preserved after annealing and lots of them are adjacent to silicon crystals.
Scenario 5. Circular pores in pnc-Si membrane. This scenario brings us back the circular pores that we are quite familiar with in the pnc-Si membrane. The biggest difference between this scenario and scenario 4 is the shape of pores.In this case, the annealing temperature is normally above 750C. Circular pores are preserved after the annealing. The reason for the big difference in terms of the pore shape between this scenario and the scenario 4 may be as the following. As the annealing temperature is higher than that of the scenario 4, more and more silicon crystals are formed during the annealing. As a result, the probability that pores move around during the annealing decreases because of the surrounded silicon crystals. Once pores are formed, they are more likely to stay there instead of moving around to coalesce. Therefore, compared with the irregular pores, small but more round pores are able to preserve after annealing.

Another feature from the TEM image is the ‘closed pores’ or ‘pits’. It seems that lots of through pores are closed and form pits after annealing. However, with the increase of annealing temperature from 750C, more and bigger through pores are able to preserve thus remaining few and few pits. One reason to explain this transition could be from the stability of silicon crystals. The following TEM images are same membrane annealed at different temperature. The left one is annealed at 800C where the right one is at 1000C. It can be seen that silicon crystal size in image (b) is bigger than that of (a).
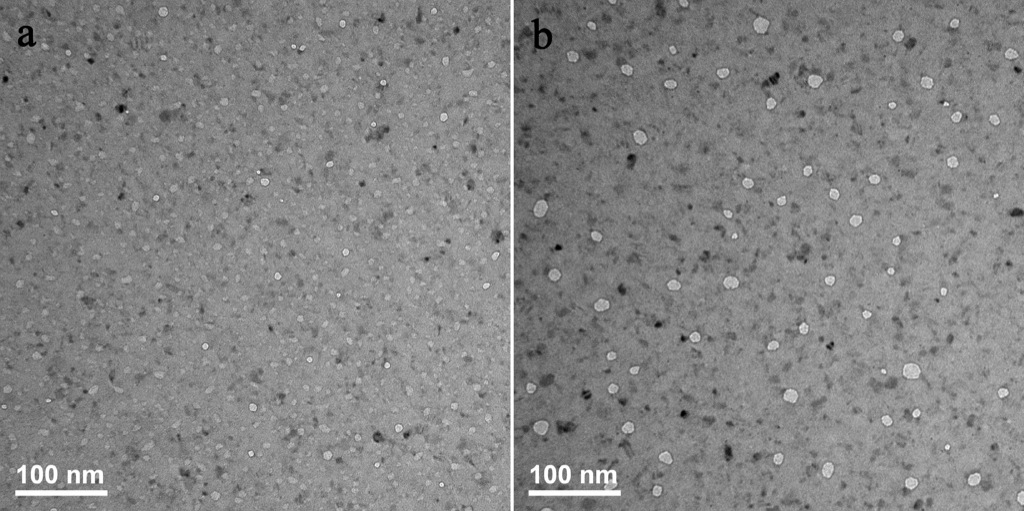
As we all know that there is a definition named ‘critical crystal size’ in the crystallization process. Basically it means that when the size of silicon crystals is greater than that of the critical size, these crystals will survive and keep growing during the crystallization process. Otherwise the new formed crystals will vanish due to the second law of thermal dynamics. It is possible that silicon crystals which is smaller than the critical size vanish during the cooling down process and the silicon atoms move to the adjacent ‘free empty area’ to close the open pores and form pits. However, once the silicon crystals are bigger enough, they are able to survive and so do the adjacent open pores.
The morphology does not change much for higher annealing temperature than that of scenario 5 except the bigger pores and higher porosity. So I think it is fair enough to include all other higher temperature annealing morphologies to the scenario 5.
In sum, five different morphologies can be achieved during the annealing of pnc-Si membrane. These five morphologies show the evolution of pores with the annealing temperature. It would be very helpful to uncover the pore formation mechanism.