Update on entropy tricks with NPN
Since my last update things have been going quite smoothly. Most pores I make are able to pass 3 or 4 samples before clogging, and I have filled in the various graphs quite nicely. I still would like to flesh out the low and high end of the DNA length spectrum, but I’ve started writing this up in a manuscript and I’ll be plugging away at both that and data generation at the same time over the rest of the summer. In the meantime, here’s a short refresher of what I’ve been doing and where we stand:
Define 
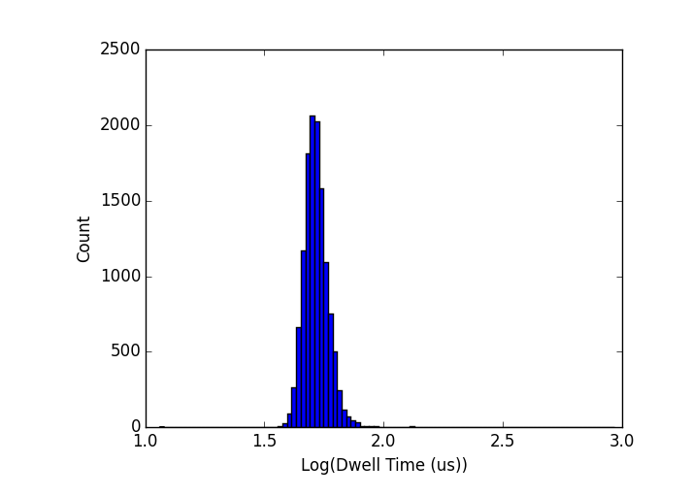

I believe the long tail is due to molecules that initially pass through 2 or more NPN pores – with multiple competing tails in the intermembrane gap the net force on the molecule will be reduced and the translocation time greatly extended, depending on the extent of the entanglement. This also explains why the tail is one-sided, since there is no mechanism for speeding up translocations in this configuration.
The average dwell time follows a power law 

Note that there are 17 points on that graph, but some of them are so consistent that you can’t actually tell them apart.
The standard deviation of the dwell time appears to have a crossover between power-law behavior for small x and exponential behavior for large x. The whole thing is well modeled by the form 

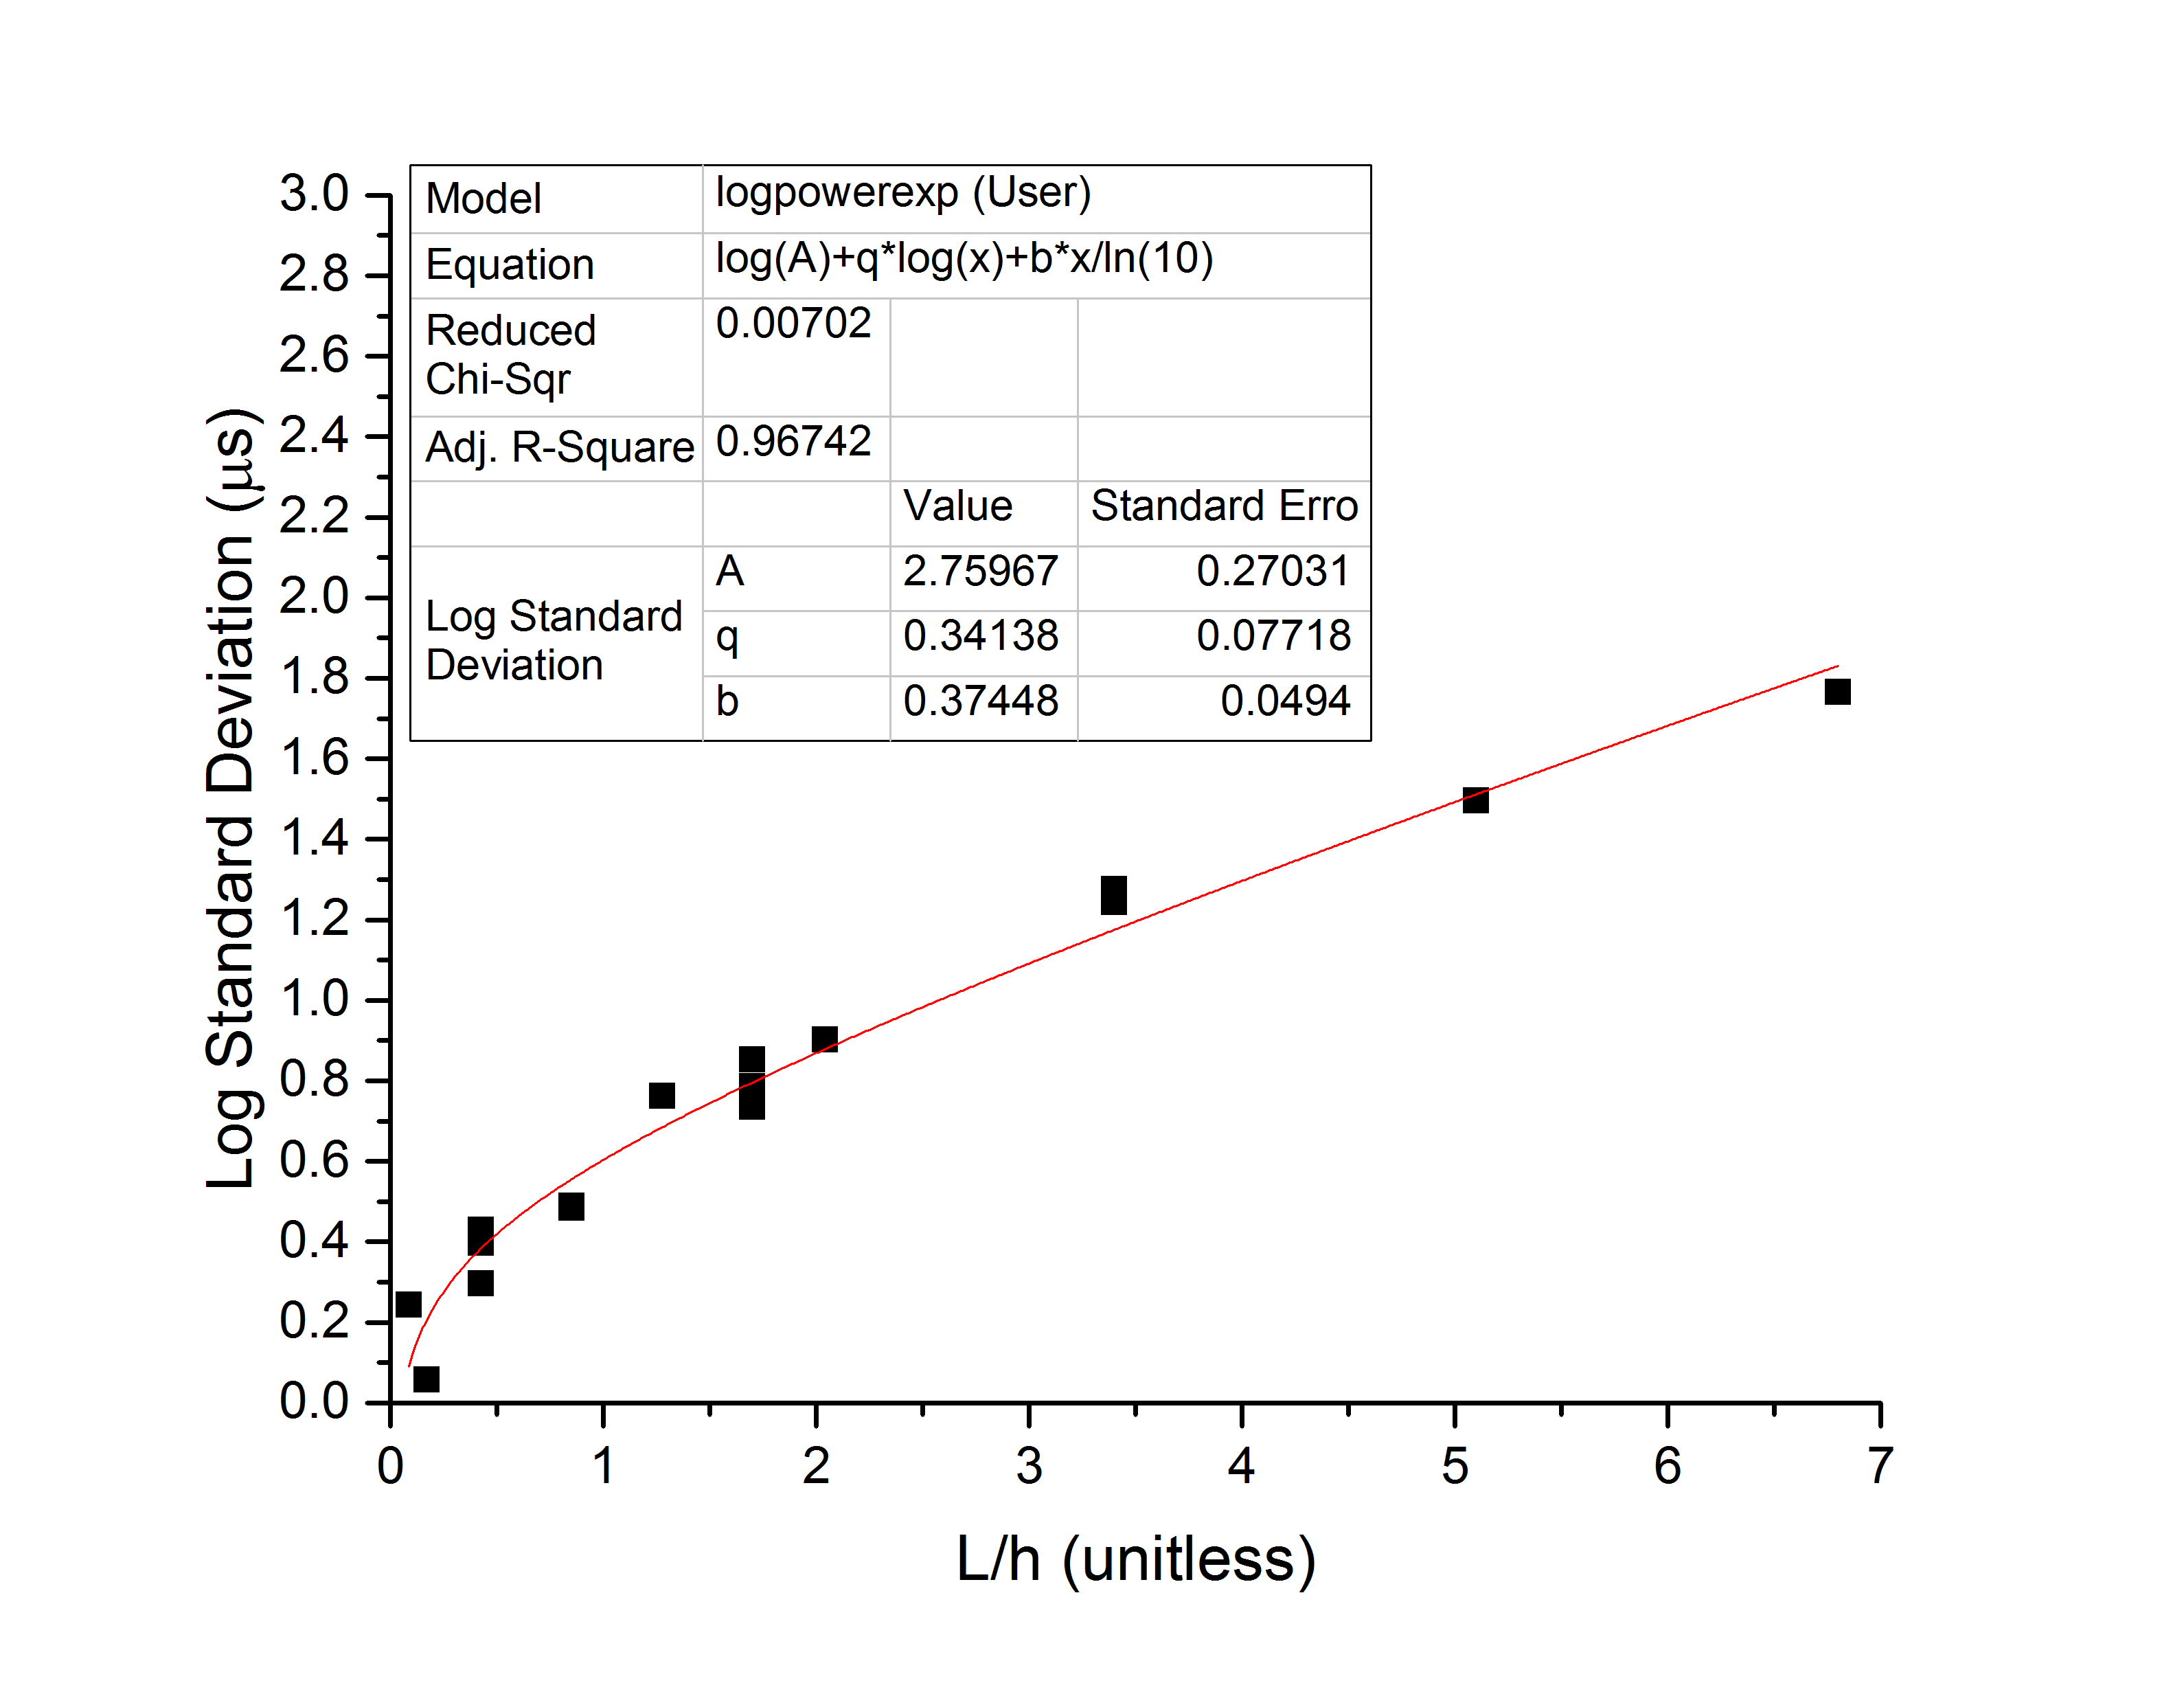
Again, there are 17 points in that graph.
Looking at the coefficient of variation, we see that it must have the form 
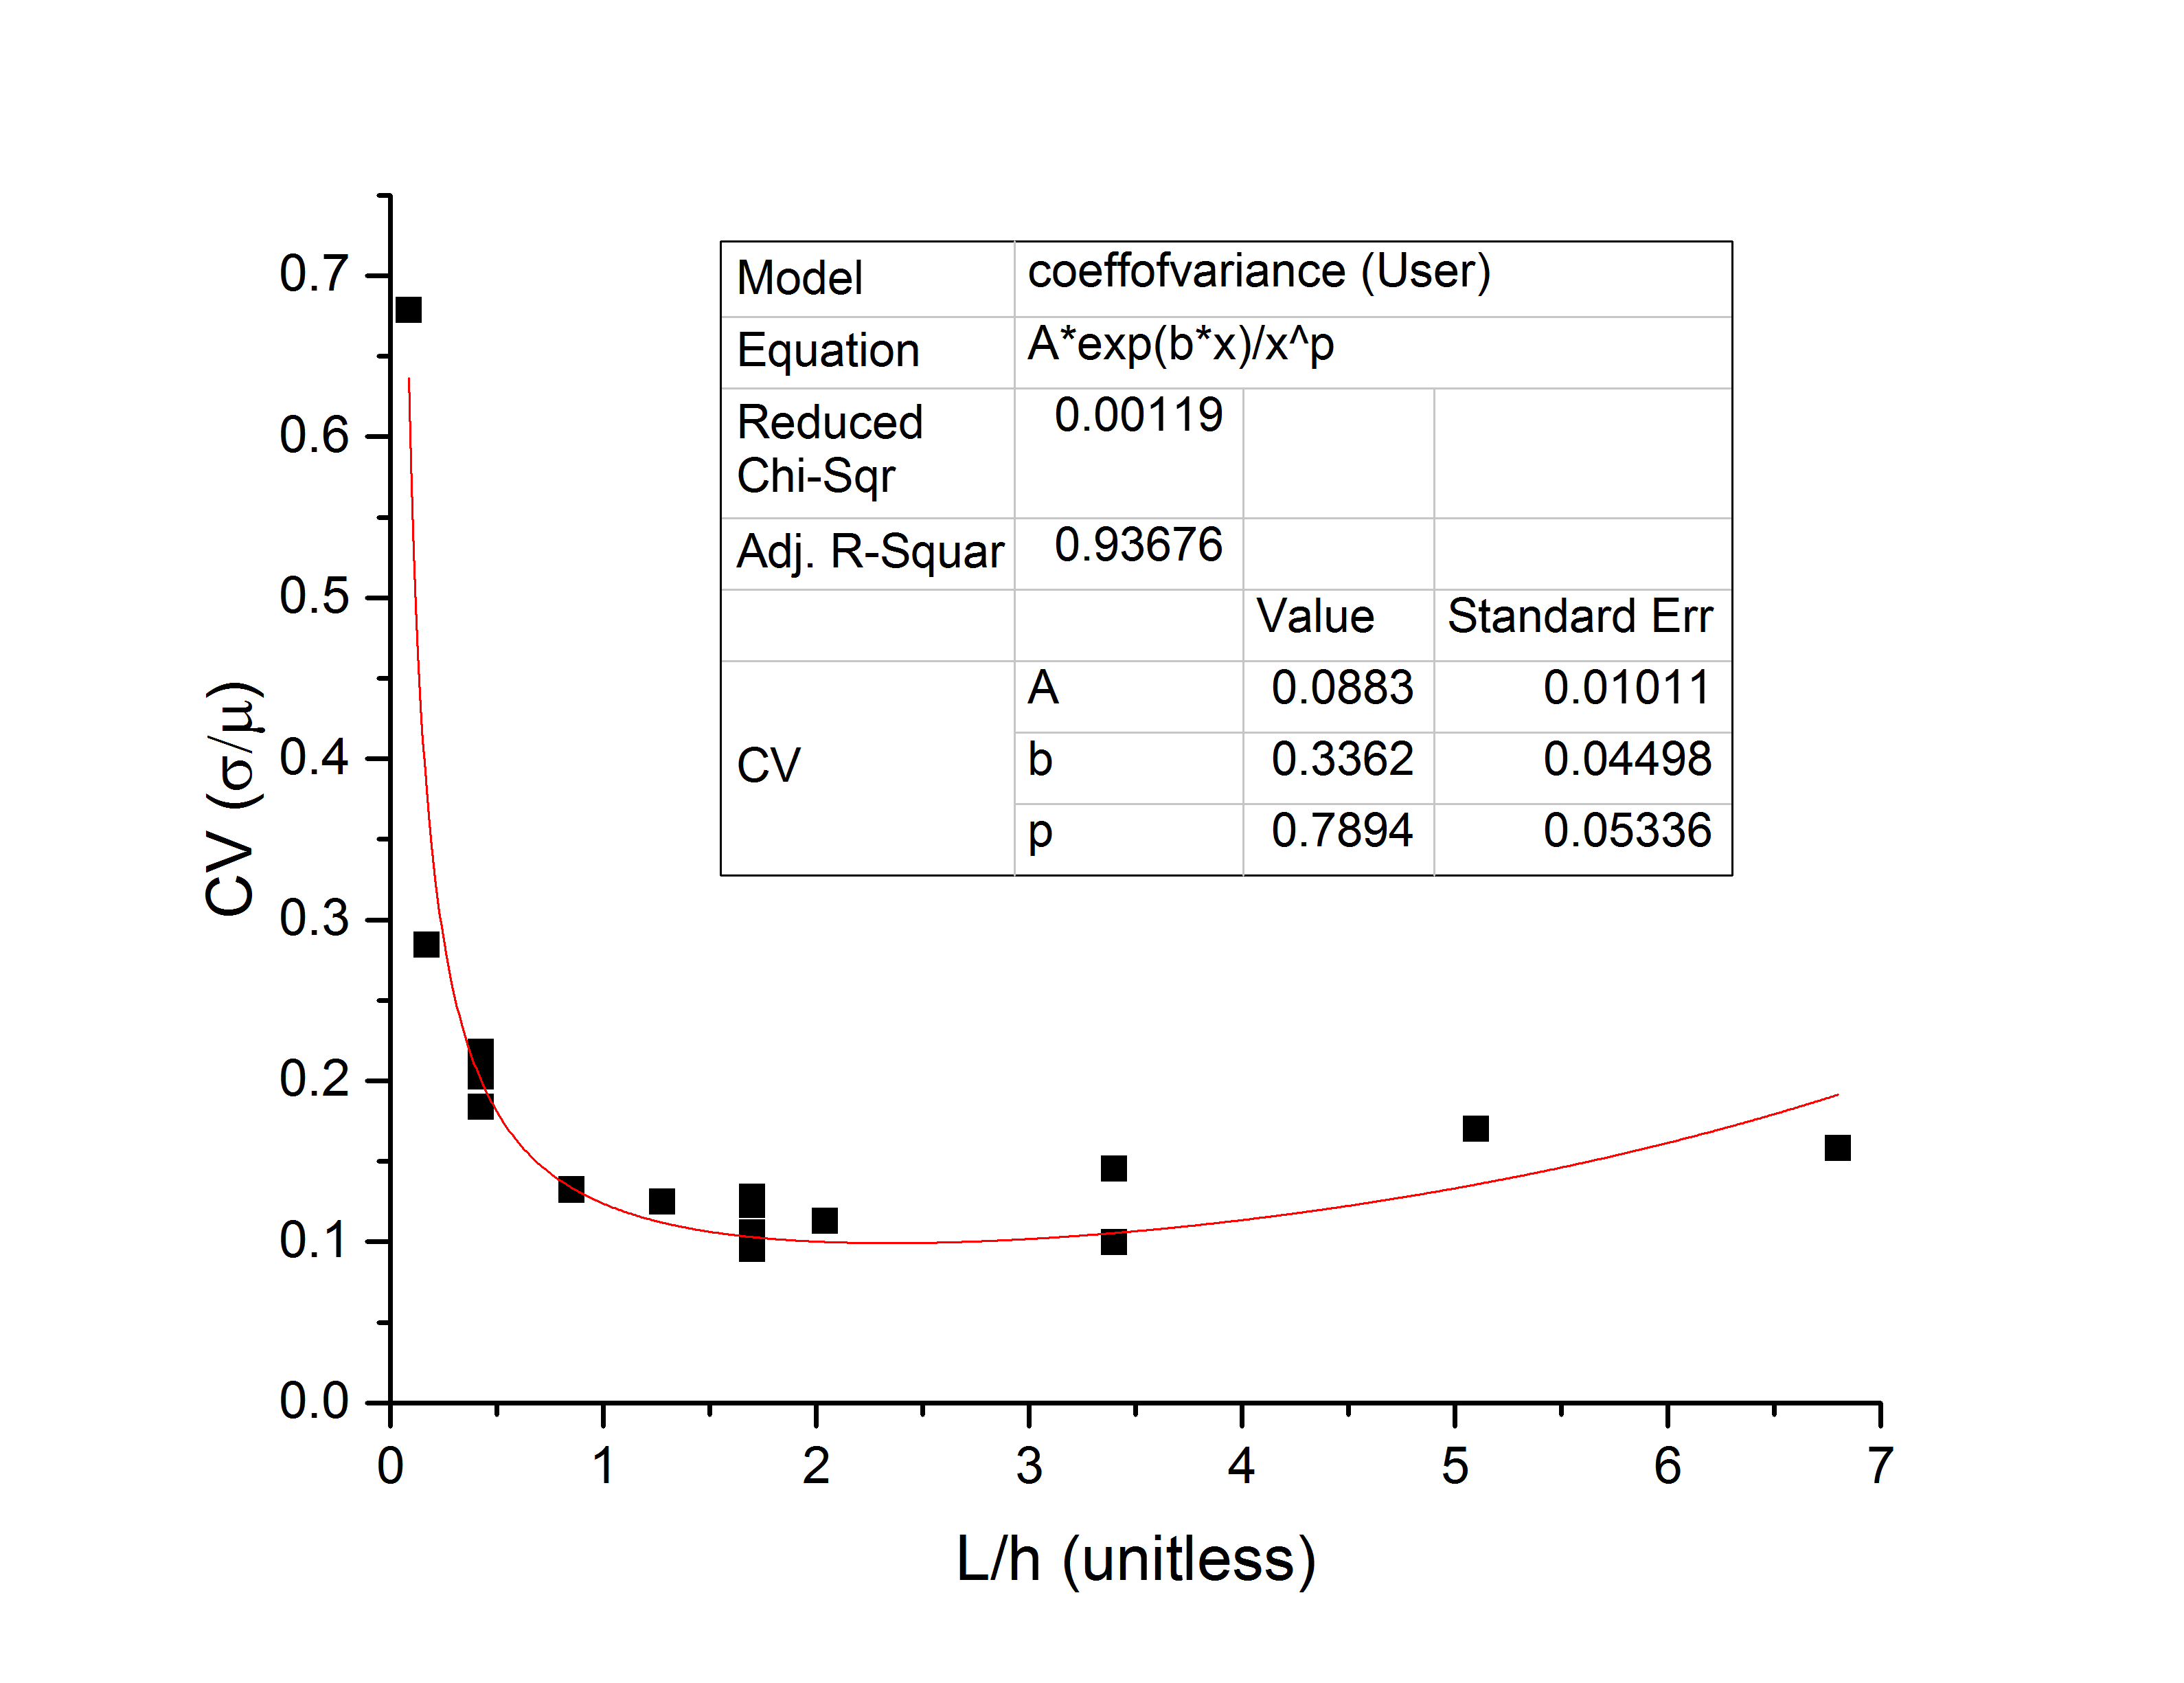
This form has a global minimum value at 

Unfortunately, but unsurprisingly, it is very difficult to get good dwell time distributions past 

I can’t really do much with that in terms of fitting the log-normal part, so I will limit myself to x<7.
I have also been examining folding distributions, since I finally had some time to write the relevant software. The results seem to indicate that for long molecules, the NPN layer has very little effect on folding, while the effect becomes more pronounced as we approach the minimum in the coefficient of variation. The story is incomplete as of yet as I have not had time to examing in detail the folding of all my pores, but so far it appears to be as follows.
In my last blog I linked , this paper which predicts a distribution of folding times as 

For 1000-bp molecules, the folding distribution I get doesn’t fit that form very well. For one of the pores I looked at, the distribution is basically flat, with a large population unfolded and a suppressed population of folded molecules:
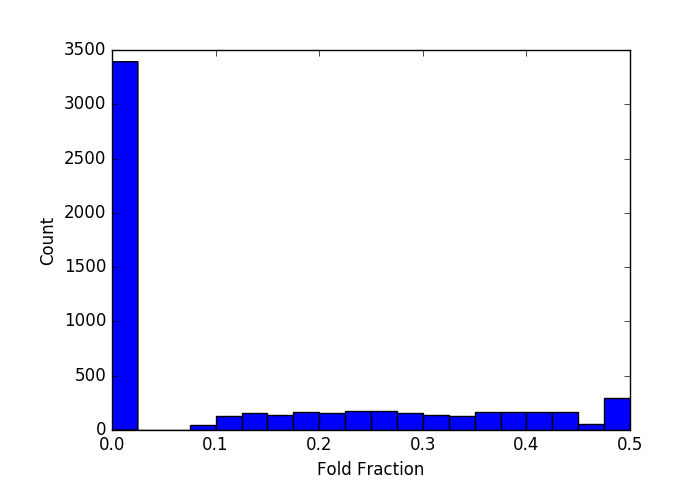
Clearly, this does not fit the model very well. 2/4 of my 1000-bp experiments look like this. For another 1000-bp experiment, I get no folding at all: out of ~3600 events, only 33 show any folding at all (there’s a tiny blip at 0.5 which corresponds to completely folded events, but it’s at the level of numerical noise:

The remaining 2/4 of the 1000-bp experiments look like this, though the other one shows at least some folding between 0 and 0.5 (~500 out of 15000 events). Note that for one of the experiments, even the longer molecules failed to show folds. I will discuss why this is later.
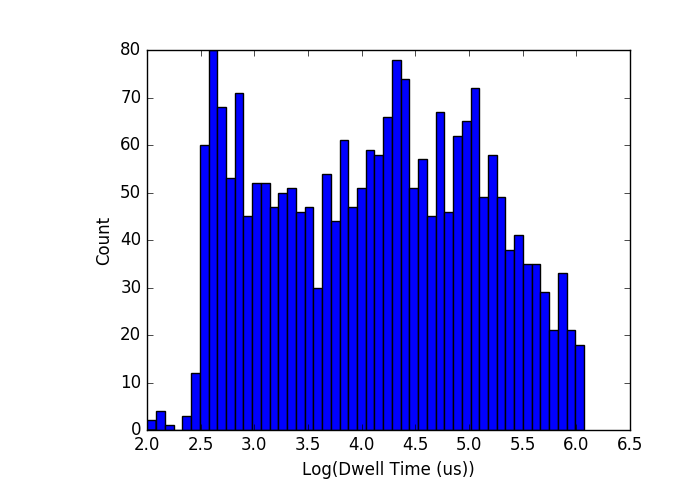
For very short molecules this analysis fails. For 250-bp this distribution looks like this (note the log scale:
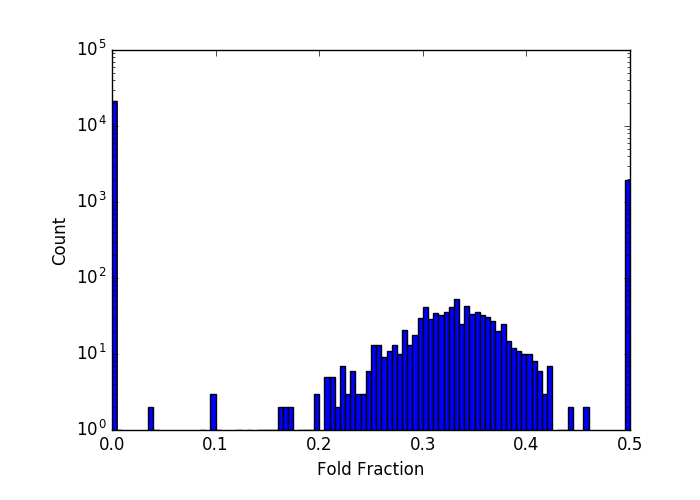
The gaps at low and high ends are not physical, but rather reflect the fact that I can’t resolve the fast folding states that would make up that gap, which instead gets folded into either the 0 or 0.5 stack. Regardless, the model doesn’t fit here either.
For longer molecules, however, the model works much better. Here are a couple of examples of 2000 and 3000-bp molecules, with a fit to the model above. Note that only A is varied, the exponents are fixed to the values found in the paper. 
 I switched to scatter plot so you could see the fit line a bit better.
So, it seems that for long molecules, the folding we see is basically that which is predicted for the case without the NPN, though they are some exceptions (the pore which shows no folding at all, for example). On the other hand, as we approach the local minimum in the coefficient of variation around 1300-bp, we start to see bigger deviations. Overall, the results are not as consistent for a given size of DNA as they are for the dwell time distributions. I suspect this comes down to the details of the NPN which happens to lie just above the pore.
Given that the electric field decays as 


A final thought worth sharing is that I think I am developing a better understanding of how the NPN transfer process works. This latest batch of NPN has been much harder to transfer than previous ones, and I believe it is because cleaning procedures may have been different. When I sandwich the NPN and oxide chips together, there is some separation distance, which must be set by the height of any dirt particles on the chips. In order to achieve contact between the membranes, I must completely fill the inter-membrane space with water, which is only possible on plasma-cleaned, hydrophilic chips that have been chilled to promote formation of water vapor. Then, as the water evaporates, it pulls the two membranes into contact. However, the gap space seems to be higher in this set of chips than previous, which means it requires more water to contact the two membranes, and even then often requires a short puff of nitrogen to seal them in. The extra water translates to a more wrinkly membrane transfer. I am guessing (correct me if I’m wrong) that the undiced NPN wafer you send underwent less stringent cleaning than previous iterations, and as a result has a few more large particles on the chips that are affecting the gap height. As it turns out it hardly matters (even when there are visible wrinkles present, the PDMS layer seals them down to the point that they are still perfectly usable), but it’s something to keep in mind. Vincent mentioned that you were working on a monolithic process for fabricating these structures, which would make my life much, much easier, so I look forward to hearing about that.
Let me know any thoughts, and suggestions for further experiments. I think things have almost stabilized now, so once I fill out the high and low end of the graph (not easy at the high end because of double-strand clogging, and not easy at the low end because it gets much more complicated to analyze very short events) I think we have enough for a very interesting story.
I’m just speculating, but the problem as you have stated is that the DNA strands are migrating through the ended pores evenly. Is it possible to tag the DNA so that one end is much more unlikely (or likely) to pass through the pore? I want to say you have done conjugated gold-DNA experiments before, but I believe they were inconclusive. Can you get a tiny nanoparticle on one end and make it unlikely to go through the double threading process (it could still pass through if it were the right size, but should hinder transport)? I might be able to generate tiny particles using the nanomembrane of various types (anything that you can sputter or evaporate), if you prefer particles of a different affinity. As you say, we will have to do better post-transfer characterization to see what kind of distribution of pore sizes we have (200-300 pores in a 1 um circle should be fairly normal, but for lower porosities maybe not). I can look into the distribution mapping of big pore/ small pore for you.
The particle generation when you breakout out the chips can be quite significant. Your hypothesis about the membrane transfer fouling because of particles is a good one, but I would be surprised if a few microns of distance would change the delamination. Rather, I would expect that the curvature of the chip may have changed, which could be 10’s of microns (silicon wafers are not perfectly flat and maintain a small radius of curvature, not sure if Simpore uses polished wafers). This is why bringing the membranes into contact with a little pressure is important before the vapor transfer.
Nanoparticle tagging is a possibility down the road, but from experience working with small tags, they add a lot of complexity at multiple stages of the project. Getting the tags onto the DNA is non trivial, and often tags will greatly complicate current signals. That being said, we are exploring similar things in the lab so it’s definitely something to look into down the road.
However, I don’t think it’s necessary, for the simple fact (see new blog post) that the NPN-pore system is most effective in a range where this multiple threading doesn’t happen anyway. To get longer molecules into the system, the best approach (I hypothesize, anyway) would be to increase the gap height to tune the system to the size you want.
Getting a handle on the size distribution in the NPN layers would be a valuable point of discussion in the paper. If you could get that, it could strengthen our points greatly. Let me know if you want me to send back soem NPN chips from the wafer you gave me (or did you keep some there?).
Curvature is possible. Regardless of the reason, the gap between the NPN and the nanopore chip is visibly larger this time around. I do use pressure in the form of an aluminum jig, so whatever the reason, it does not respond to the pressures that the jig applies.