Raw Data (including preliminary models) and Figure Drafts for the Modeling Paper
Below are drafts of all the figures I am planning on incorporating into my upcoming model paper. I believe I am done with data collection at this point. Data in figures not marked “NEW” probably needs to be updated.
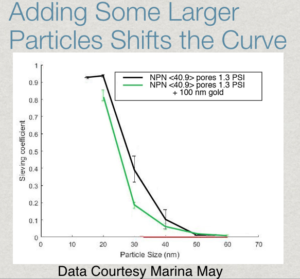
Note that all model curves are calculated with no fitting parameters. They are derived from base principles. That’s why they aren’t perfect.
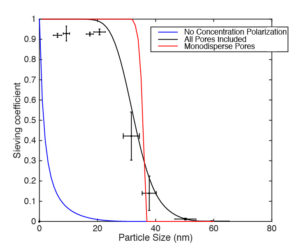
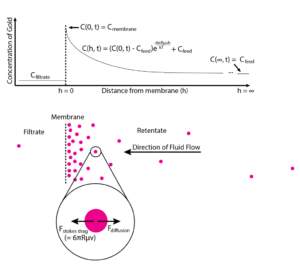
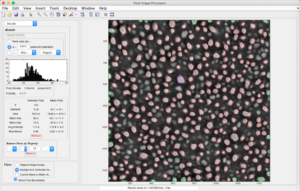
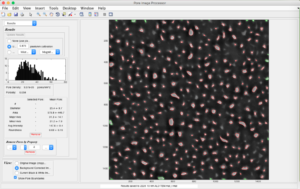
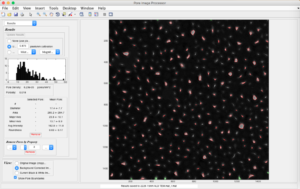
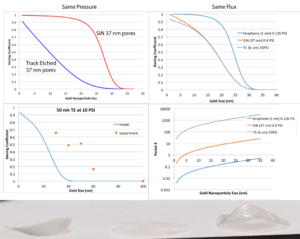
NEW: Figure 1 – a prettier version of these two images, demonstrating that concentration polarization is the key to understanding these separations.
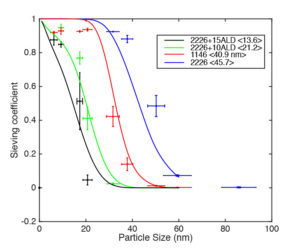
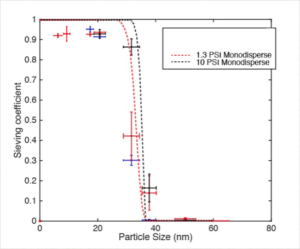
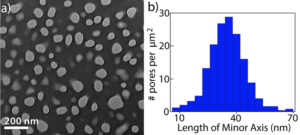
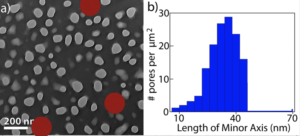
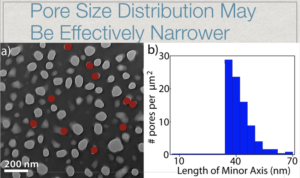
NEW: Figure 2: Sieving vs. gold size for 4 different NPN membranes. Will also eventually include TEMs of all four membranes and their respective pore size histograms (I have this data already but I haven’t made it look pretty yet).
NOTE for all new data sets, x error bars are standard deviations based on TEM images of particle sizes (N > 12), y error bars are standard error (N = 3 separate filtration runs for all sets except 1146 <40.9 nm> at 1.3 PSI, which had an N = 5).
Additional data, relevant since Kyle’s post about partially closed pores:
Wafer 2226, average pore size 45.7 nm:

Wafer 1146, average pore size 40.9 nm:
Wafer 2226 with 10 nm alumina ALD, average pore size 21.2 nm:
Wafer 2226 with 15 nm alumina ALD, average pore size 13.6 nm:
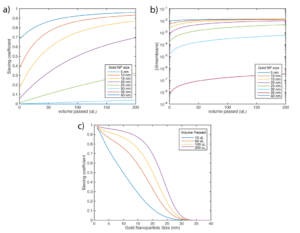
NEW: Figure 3: Sieving vs. gold size for 0.4, 1.3, and 10 PSI

Possible aside to figure 3:
NEW: Figure 4: Comparison of pressure-dependent behavior for NPN and two different track etched membranes. I don’t know why 50 nm pore diameter TE (track etched) membranes are able to always hold 20 nm gold back but the behavior persisted across 2 different batches of 50 TE membranes, and SEM analysis of the TE membranes verified that they were in fact ~50 nm average pore diameter. Further, 30 TE seemed to have cutoffs of around 7-10 nm. In the paper I plan to wave my hands quickly and say that, despite the manufacturer’s claims to the contrary, the pores are probably hourglass shaped with an effective pore diameter much smaller than the diameter at the surface. Of course, if that’s the case, why 80 nm TE membranes behaved as expected is an open mystery – one beyond the scope of this work I dearly hope. The model uses an assumed monodisperse pore size of 23 nm to fit the TE 50 data.
It’s also unfortunate that TE 50 seem to have razor-sharp cutoffs. But it might make sense, given that they have almost perfectly monodisperse pore sizes. Also note that 10 PSI is above the manufacturer’s recommended use pressure and that many of them broke to get that data set. Generally, TE membranes were miserable to work with.
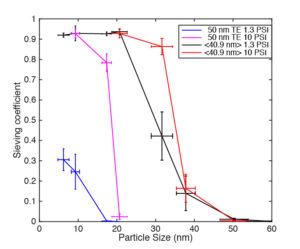
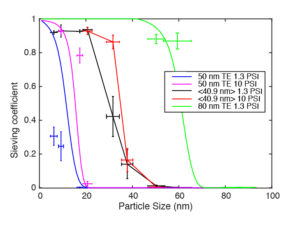
Figure 5: Model predictions for graphene/NPN/TE membranes and Peclet analysis, similar to the following older figure (ignore the 3rd and 5th sub-figures)
NEW: Figure 6: Passing twice the volume through the membrane changes sieving behavior

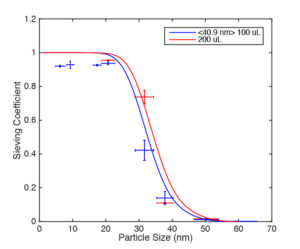
Figure 7: Analysis of Volume dependent-curves, similar to this but with updated model curves