Ultracentrifugation Exosome Controls: An Unusual Observation in Separation
In attempting to generate control systems for our exosome work as well as to potentially develop a system that would help some collaborators at the University of Illinois, I have been working with the ultracentrifuge again to hopefully isolate a pure fraction of exosomes, devoid of any protein components. This would allow us to start from a base of pure exosomes in PBS and then attempt to isolate them on the membrane, either in tangential flow or SepCon to get better images and a better understanding of how the system would work ideally (i.e. if there was no contaminating components to interfere with capture). Additionally, we would be able to use the SepCon format, which would provide fast immobilization of the exosomes, which might be desired by the group in Illinois.
The first experiment I ran with this was right before the break and I took the frozen plasma, weighed it so that the tubes matched in the 1000th place (using approximately 500 uL) and the spun it for two different times. We learned that the group in Illinois spins their samples for 24 – 48 hours, so I decided to spin for both times. I set the speed at 100,000 x g, or 41,000 rpm on the TLA.55 rotor. The next day, I removed the first set of samples and noticed a distinct phase separation as shown in Fig. 1.
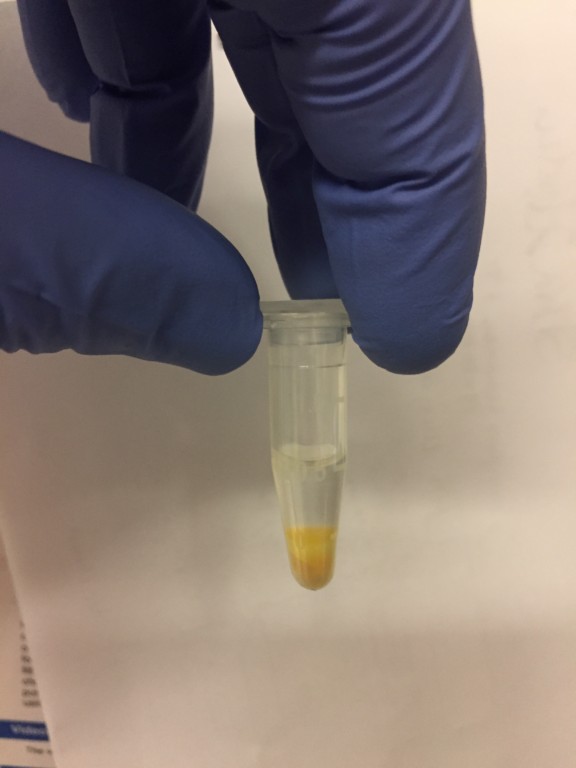
Figure 1: Frozen plasma, 48 hour, 100,000 x g ultra run. Note the distinct phase separation.
I don’t recall seeing this separation the previous time that I ran the ultracentrifugation protocol and I did a quick literature search and could not find any results where they talked about this type of separation after centrifuging blood plasma, frozen or fresh. However, despite this separation, I couldn’t really see a pellet. So I separated each layer and then resuspended each to a volume of 1 mL with PBS. I then ran each through a SepCon at 3000 rpm for 10 minutes and then fixed each sample with glutaraldehyde. What was immediately evident was the fact that the bottom fraction, which was the most viscous, passed all the solution through, while the other two fractions has only approximately 25% pass. This was interesting because the bottom fraction was incredibly viscous, as we can see in Fig. 2, which is a sample of the bottom component that I isolated today (the 29th) with tweezers.
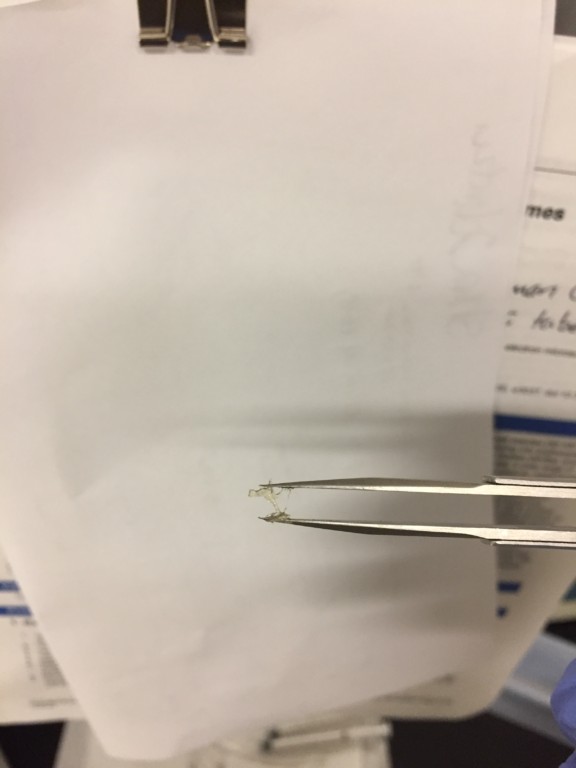
Figure 2: Bottom fraction removed from the tube with tweezers due to viscosity.
After the fixing, I threw the samples in the SEM and imaged. What was immediately obvious was the large amount of vesicular structures close to 1 um in size in the bottom fraction sample (Fig. 3). The top fraction sample had a large protein layer built up on the membrane and as such, I could not really focus on the surface, but I couldn’t see any pores on the active area (Fig. 4). The middle fraction was the most interesting and I saw what appeared to be E. coli all over the membrane sections, but not on the support structures (i.e. the rest of the chip) (Fig. 5). Looking closer, there was evidence of particles that were in the size range of exosomes, so perhaps the exosomes were isolated in this middle layer with the bacteria (Fig. 6).
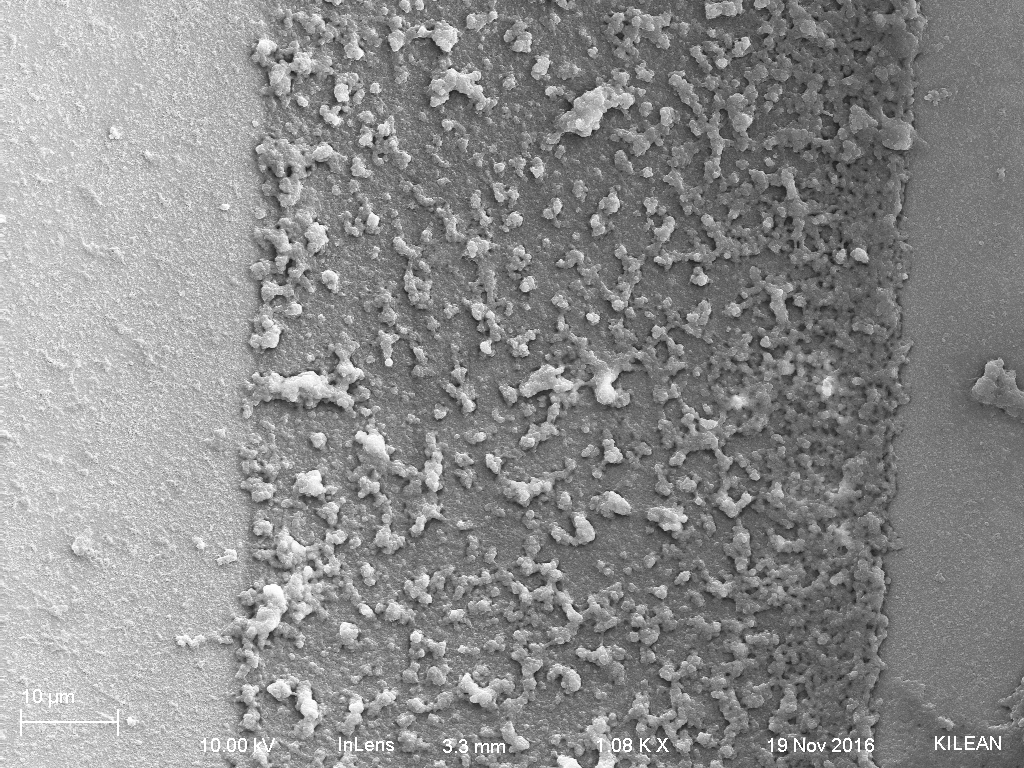
Figure 3: Bottom fraction
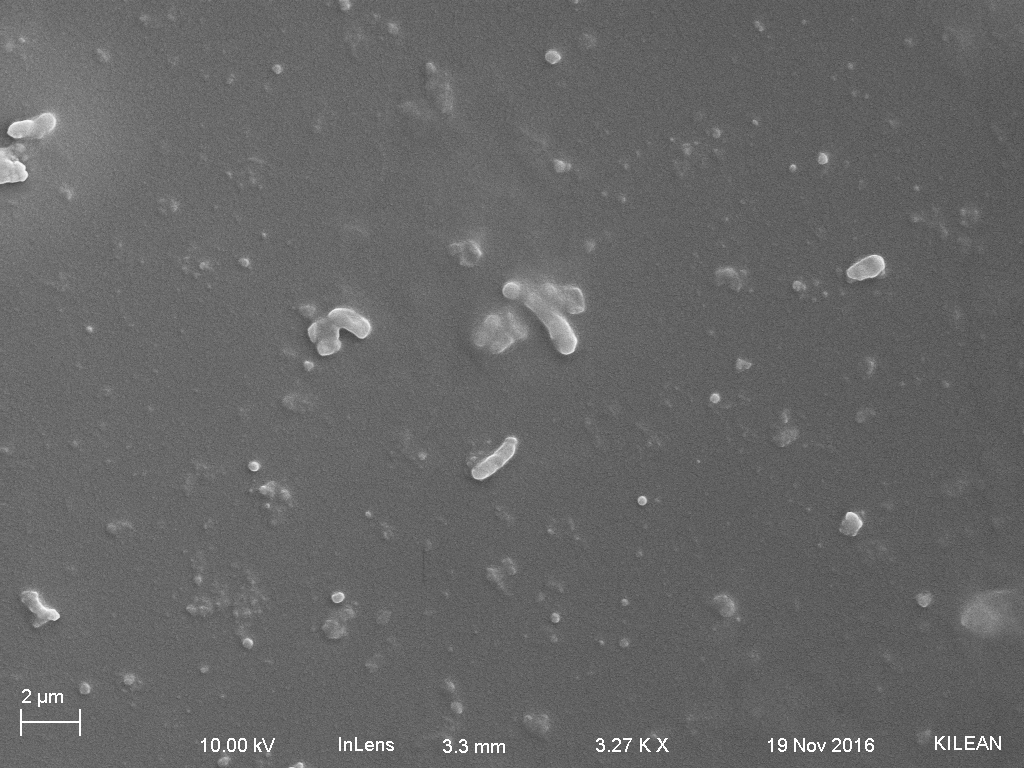
Figure 4: Top fraction

Figure 5: Bacteria in middle fraction
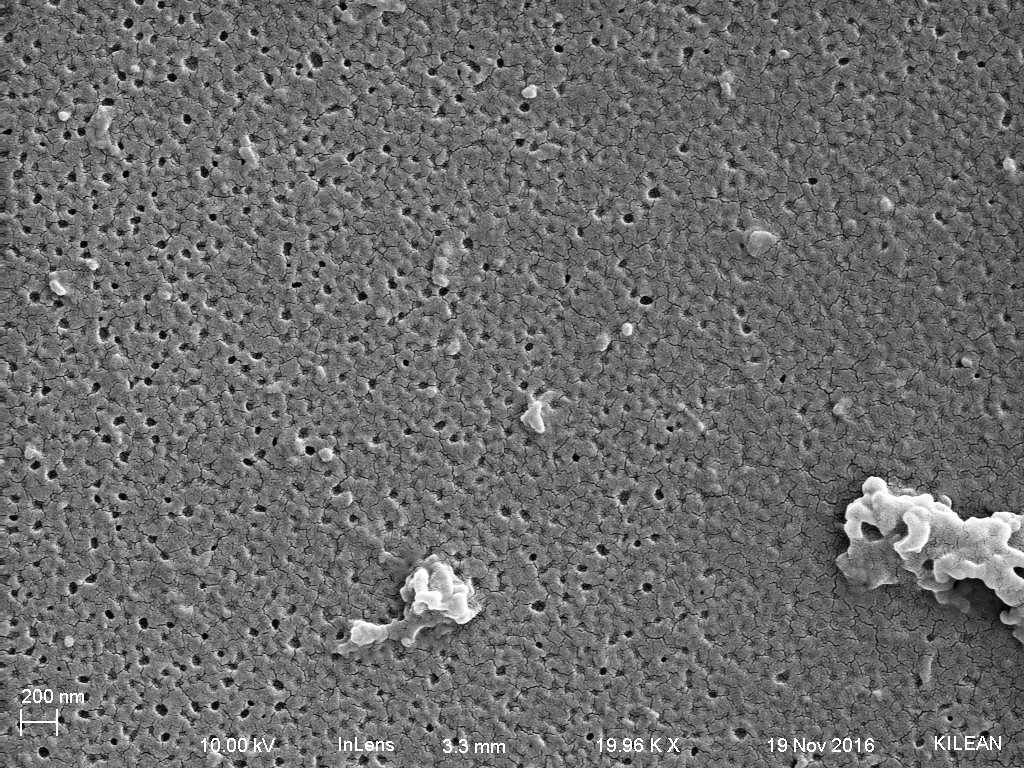
Figure 6: Closer look at the membrane in the middle fraction
Where I stand right now is in the middle of repeating this experiment to determine if we see this again. Additionally, I want to see if this arises from the frozen plasma only or if it will occur with fresh plasma. Finally, is it possible that this occurs at a shorter time than 24 hours or is the separation only possible at longer centrifugation times? I started an experiment yesterday with both fresh and frozen plasma and checked the samples at midnight, for a 12 hour time point. I did not observe full separation in either the fresh or frozen plasma samples, but there was distinct separation of some of the components (Fig. 7 and Fig. 8 respectively). However, when I pulled the samples out at 12 today, the full separation had occurred, suggesting that it takes longer than 12 hours to observe this.
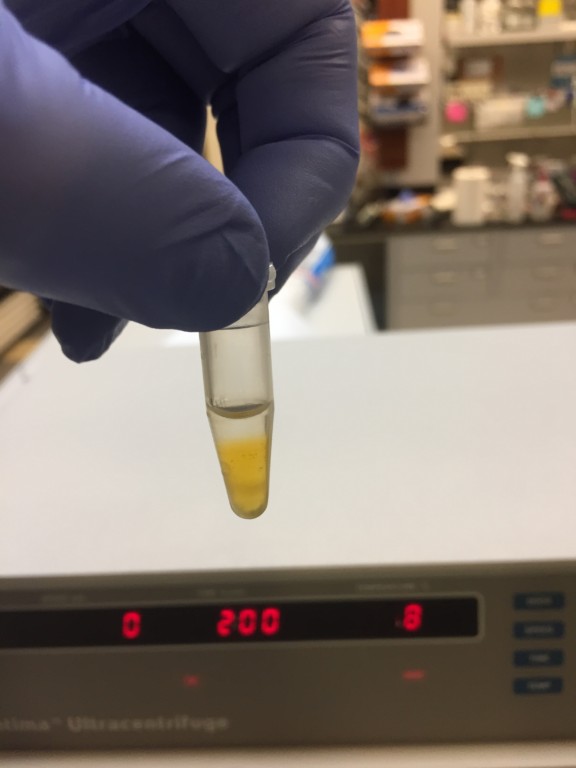
Figure 7: Fresh plasma at 12 hours
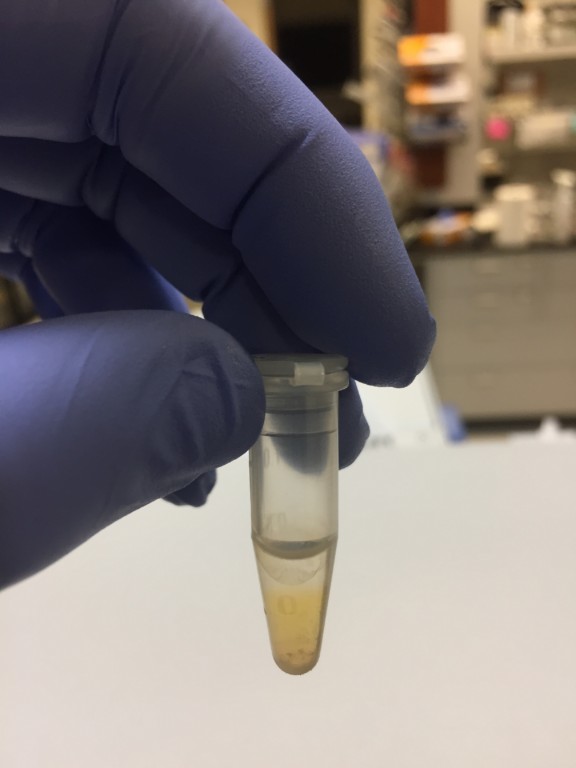
Figure 8: Frozen plasma at 12 hours
The samples from today showed separation, but there was a distinct difference between the frozen plasma separation and the fresh plasma separation. The fresh plasma had less of a darker fraction on the bottom and more of a darker band at the middle of the sample. The frozen plasma had a thinner band in the middle and a thicker band on the bottom (Fig. 9).
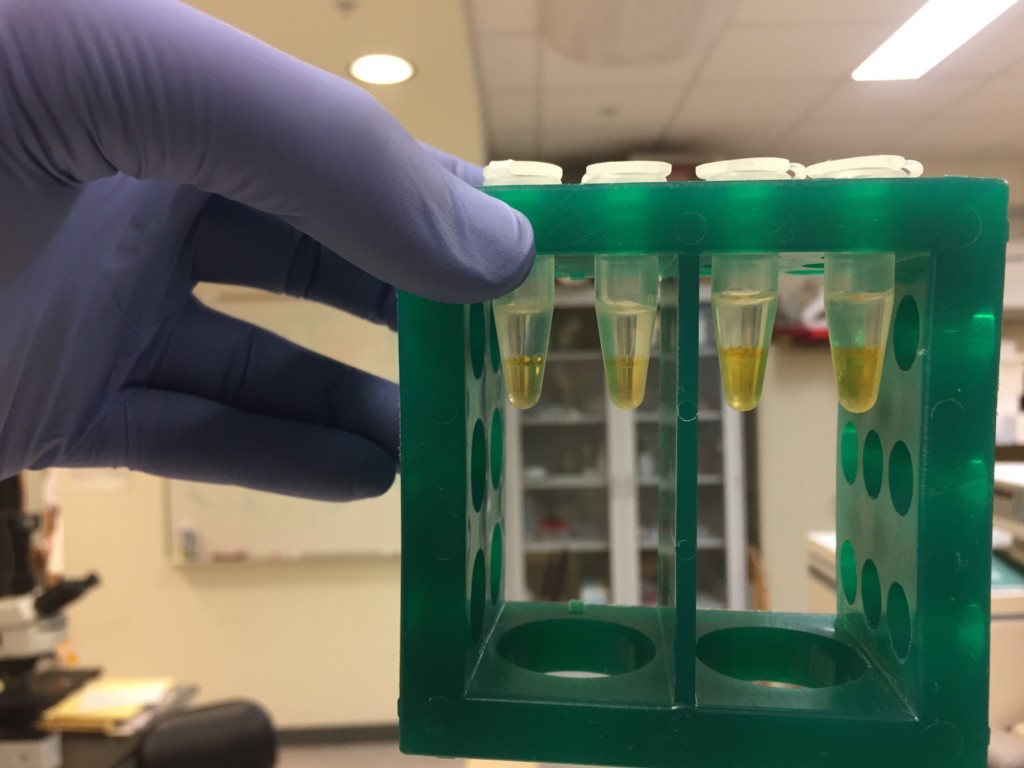
Figure 9: 24 hour plasma separation with frozen plasma on the left (2 tubes) and fresh plasma on the right (2 tubes).
Again, there did not appear to be a pellet in the frozen plasma sample, but the fresh plasma had what appeared to be a very faint pellet on the side of each tube, so perhaps there are exosomes that were isolated during this experiment. I plan on running these through the SepCons again and imaging, as well as imaging my 48 hour samples from last week at some point later today or later this week, so there will be an update to this post very soon.
Finally, this is an image from Dr. Stephen Boppart’s group at the University of Illinois showing the potential for nanomembrane applications in isolating exosomes and causing them to remain in place for imaging.

Figure 10: University of Illinois data showing tumor microenvironment.