Partial Sieving Curves for 50 and 100 nm Thick NPN
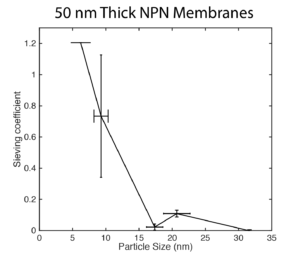
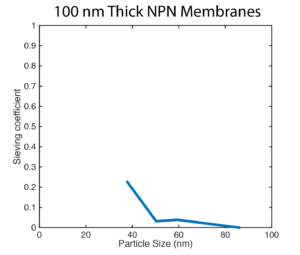
The x-values are based on TEM images of the last populations of gold nanoparticles (I think. I can’t remember immediately when the fridge died on us). It’s probably worth re-doing that with the new gold vials.
There’s still some work to be done. In the 50 nm NPN, 5 nm gold was only done once, but all the other data points were done three times. 100 nm NPN datapoints were just done once.