Dialysis Rotation Project
Introduction
Throughout my rotation, I have been working on the dialysis project with Alec. The goal was to set up a multi-pass system to analyze the membrane’s ability to separate different molecules in blood. The critical separation is between β2-microglobulin (12 kDa) and albumin (66 kDa) – β2-microglobulin is a large toxin that needs to be removed and albumin should be retained. We are using cytochrome c as a surrogate for β2-microglobulin because cytochrome c can easily be quantified by absorbance and is approximately the same size. BSA is used for albumin.
The device for these experiments consists of several layers, shown in Figure 1: from bottom up – glass cover slip (not shown), 120 μm adhesive tape, three layers of 300 μm silicon gasket with the chip sandwiched in between, 120 μm adhesive tape, PDMS. The assembled device is shown in Figure 2.
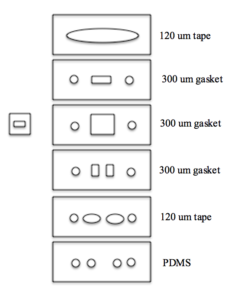
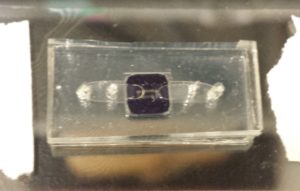
We are using the 75nm silicon nitride membranes. We originally started with 100 nm membranes, but switched to 75nm to match with other tests already completed for the project. Since cytochrome c (3nm in diameter) and BSA (7nm in diameter) are both much smaller than the pores, we are relying on the difference in diffusion time to facilitate the separation, rather than the physical barrier of the membrane.
Our multi-pass system went through a series of revisions, but there were several components of the set-up that were kept constant throughout. Tubing is connected so the “dialysate” fluid (1x PBS) flows through the bottom chamber and the “serum” fluid (cytochrome c and BSA in 1x PBS) flows through the top chamber. The experiments were run for 24 hours with 1 mL of fluid in each side and the fluids were assayed at the end of the 24 hour period. A new device was used for each run.
First Setup
The first system is shown below (Figure 3). Figure 4 shows a close-up of the device and the direction of fluid flow.
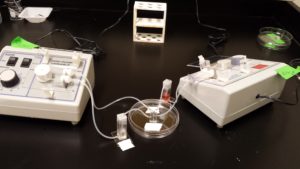
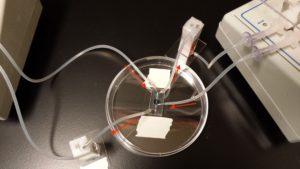
Initially, we had two different pumps and had to run the dialysate (1.2 mL/min) at approximately twice the flow rate of the serum (680 μL/min). This did not seem like an issue at first, as we collected several samples without any indication of system malfunction. However, there were a series of runs where this format was causing an issue with the dialysate fluid being transferred through the membrane and ending up in the serum reservoir. Kilean took a video of the system as it was running overnight; there was gradual decrease in the fluid level on the dialysate side, corresponding to an increase in fluid in the serum reservoir. This indicated that the issue was not caused by a sudden tearing of the membrane or poor device-making skills on my part. I also viewed the membranes under a microscope to confirm that the membranes were intact.
Next, I elevated the serum reservoir on a LabJack to increase the pressure on the serum side and ran the experiment for 24 hours. The outcome was a reversal of the initial problem – all of the fluid drained into the dialysate reservoir. This suggested that the issue was a pressure imbalance on the membrane.
Second Setup
Our second system (Figure 5) attempted to address this pressure difference by setting equal flow rates for the serum and dialysate. We got new pumps that were capable of the same flow rate (640 μL/min) and switched them out in the first system (all other components were kept the same).
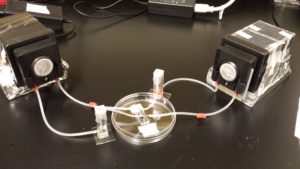
This set-up showed the same issue as the previous one, despite the equal flow rates. To analyze this further, Alec took pressure measurements across the membrane and determined that the best solution was to exchange the reservoirs for air tight capacitors and switch the order of the components in the circuit. The first and second systems were set up as pump -> device -> reservoir; this circuit has the pump pushing fluid through the device so differences in geometry on the top and bottom of the chip create a transmembrane pressure that causes fluid flow across the membrane.
Third Setup
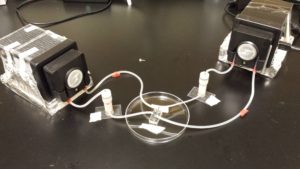
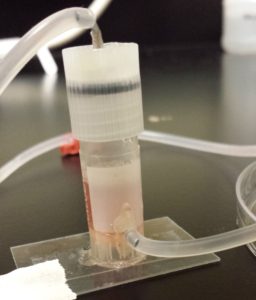
The third set-up changes the order to pump -> capacitor -> device so the pump is pulling fluid through the device and transmembrane pressure is minimal (see Alec’s post on this for more details). Figure 6 shows the third setup and Figure 7 shows one of the capacitors used in place of reservoirs. One thing to note about setting up this system is that you want to get fluid running across both sides of the membrane before you screw the caps on the capacitors to avoid generating a lot of pressure on the device.
Results
Using the third revision of the system, we were able to get three one-day experiments without losing fluid or getting crossover of fluids through the membrane. Cytochrome c concentration in the initial dialysate and serum compared to the final fluids was measured by diluting 10uL of the sample in 40uL of 1x PBS and finding the absorbance at 405nm. Absorbance was converted to concentration using a standard curve. Figure 8 shows that the concentration of cytochrome c in the serum decreased while the concentration increased in the dialysate. Error bars represent the standard error for the three runs. The initial dialysate and serum were the same for all three runs.
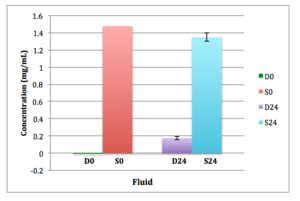
There was about 90% of the initial cytochrome c remaining in the serum after the 24 hour run.
Calculations
Theoretical calculations showed that cytochrome c should take about 16 days to reach equilibrium. The diffusion coefficient was calculated using the formula:
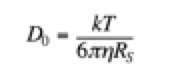
Boltzmann’s constant, k = 1.38064852*10^-23 J/K
Viscosity of PBS, n = 1.05*10^-3 Pa-s
Radius of cytochrome c, Rs = 1.7*10^-9 m
which gives a diffusion coefficient of 1.2228*10^-6 cm/s.
The equilibrium time constant was then calculated as 786 s:
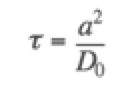
Diffusion distance, a = 310 um
The number of loops completed in one 24 hour experiment [flow rate (640 uL/min) * total time (24 hr) * volume (1 mL)] is 922.
The volume above the membrane (calculated as the area of the trapezoid times the length of the trench) is 0.57 uL (w1=700 um, w2=1138 um, D=310 um, L=2mm).
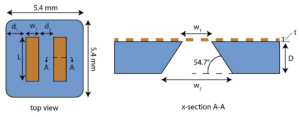
The residency time (volume above membrane/flow rate) is 0.05 s and the number of loops necessary to reach equilibrium (ratio of diffusion to residency time) is 14, 712 loops. The equilibrium time is the number of loops to reach equilibrium divided by the number of loops per run, which is about 16 days for cytochrome c. These same calculations were also done for BSA, which comes out to about 33 days (Rs=3.48*10^-9 m, D0=5.97*10^-7 cm/s, τ=1609 s, diffusion/residency ratio = 30117).
Estimating diffusion as the exponential equation, e^(t/τ), with t=time of the run (24 hrs) and τ=time to reach equilibrium, there should be 94% of the original cytochrome c remaining. This shows a reasonable comparison to the experimental value of 90%.
Based on these results, we decided to try 2.5 day runs to increase the amount of cytochrome c passing through the membrane. With these longer runs, we saw an undesired exchange of fluid similar to the initial set-up, but with the serum level decreasing rather than the dialysate. Oddly, the dialysate fluid level did not increase (to match the decrease from the serum side), although there was evidence of a higher cytochrome c concentration in the dialysate (visual observation, not quantified). This suggests that there may be some evaporation occurring, despite attempts to minimize this with a closed system from the airtight capacitors. It also indicates that the third setup was only a temporary solution to the problem with fluid exchange across the membrane, since the system cannot tolerate experiments longer than one day.
Since we had already looked at balancing pressure, we decided to calculate the hydraulic resistance on either side of the membrane since the device has an asymmetric design, using the following formula:
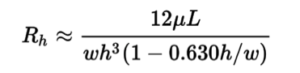
Resistances were calculated for each component on the top and bottom of the the membrane and summed in series. The bottom channel (2.713 x 17.275 mm) and bottom sealer (1.8 x 4 mm) were added for the resistance below the membrane. The top channel (1.772 x 4.596 mm), top sealer (1.986 x 1.197 mm), and chip (see Figure 9, estimated trench as a rectangle) were added for the resistance above the membrane. The resistance across the top was 3.48*10^10 kg/m4/s and the resistance across the bottom was 4.15*10^10 kg/m4/s (not confident these units are correct). These resistances seemed too similar to be an issue, especially since they are just estimates of the actual resistance.
Notes for Future Testing
Due to timing, this is where I ended my rotation. In order to move forward with assessing the membrane’s ability to separate cytochrome c from albumin, this issue with fluid imbalance needs to be solved to ensure we have a robust system for accurate data collection.
- One thing to note about these devices is they accumulate a lot of bubbles. If the bubbles are trapped over the membrane, it might lead to a pressure differential. It might be useful to look into ways to reduce bubbles.
- If there is any way to validate the hydraulic resistance calculations with real measurements, this might be a good idea to try.
- I think it would be worth trying another 24 hour experiment with the third setup to confirm that it works for the shorter time period. Since there weren’t any issues when running for 24 hours (they only appeared after 2.5 days), there might be a component of the setup that fails over time. I noticed that the section of tubing that fits over the rollers on the pump is fine after 24 hours, but gets worn out after 2.5 days. This may change parameters between the two sides (such as flow rate) that we need to be the same.