Beads experiments with NPN membranes
Hello Everyone,
For the next figure in our paper, and to make the transition happens smoothly from Track Etched membranes to NPN membranes, we decided to run the same beads experiment on NPN membranes as well.
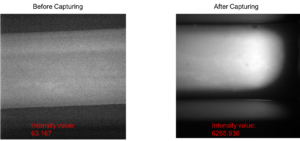
So Kilean and i started working on these experiments, and the first experiment was to capture and release 100 nm beads over 70 nm NPN membrane, 100 microliter of the sample with 10^11 particles/mL concentration.
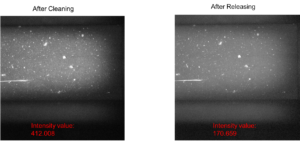
Here you can see fluorescent images of 4 different steps including before capturing, after capturing, after cleaning, and after releasing with their intensity values.
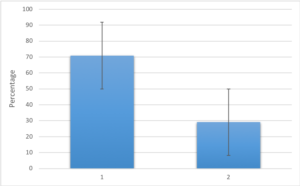
The data analysis also shows that after capturing and cleaning: almost 70% of the signal is coming from capturing beads that were released in the releasing step and 30% is from the non-specific captured beads. This graph is generated from intensity values of 16 different regions of interest on the membrane.
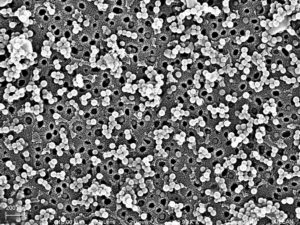
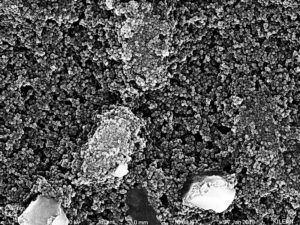
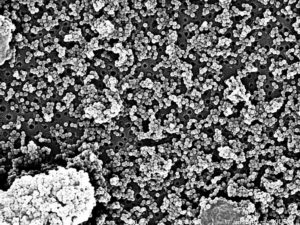
So we saved this sample for SEM (After releasing), and Kilean took SEM images of this step:
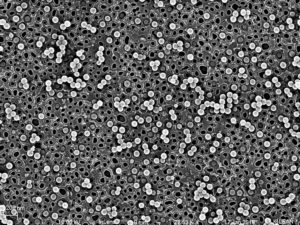
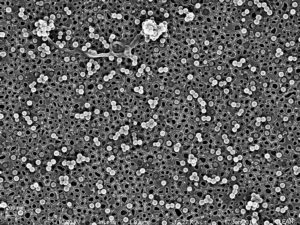
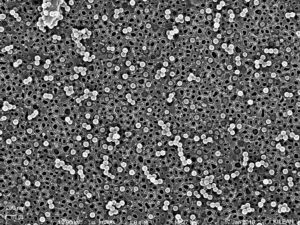
He also imaged after capturing step but without cleaning, here are the images:


We will repeat this experiment 2 times and the same figure as Track Etched exosome scale will be generated for this.