Transmembrane Pressure Monitoring: Track Etch vs. NPN
As Aim 1 of my thesis involves using theoretical models to be able to predict particle capture, it is important for me to fully understand how each model system behaves when compared to experimental results. One of the most important of these systems is the pressure drop across the membrane in our devices. I have hypothesized that the pressure drop is crucial to maximizing the number of particles (exosomes) captured in pores on the membrane and we have to ensure that we maintain the correct pressure to achieve this. Additionally, we are motivated to provide a comparison of track etch membranes and nanoporous silicon nitride membranes to prove that our membranes operate at significantly lower pressures and are therefore less likely to lyse cells and/or vesicles. This data is a key figure in the paper that Aslan and I are working on.
In order to perform this analysis, I had to compare first order models that estimate pressure drop analytically, COMSOL Multiphysics results that predict the pressure drop computationally, and experimental results that were obtained with the LabSmith system we have for monitoring pressures. As an additional step, I calculated the data for a distribution of pore sizes, which is shown below, as well as using both the Hagen-Poiseuille equation and the Dagan equation for the resistance of a pore. Both equations are found in Henry’s Lab on a Chip paper.
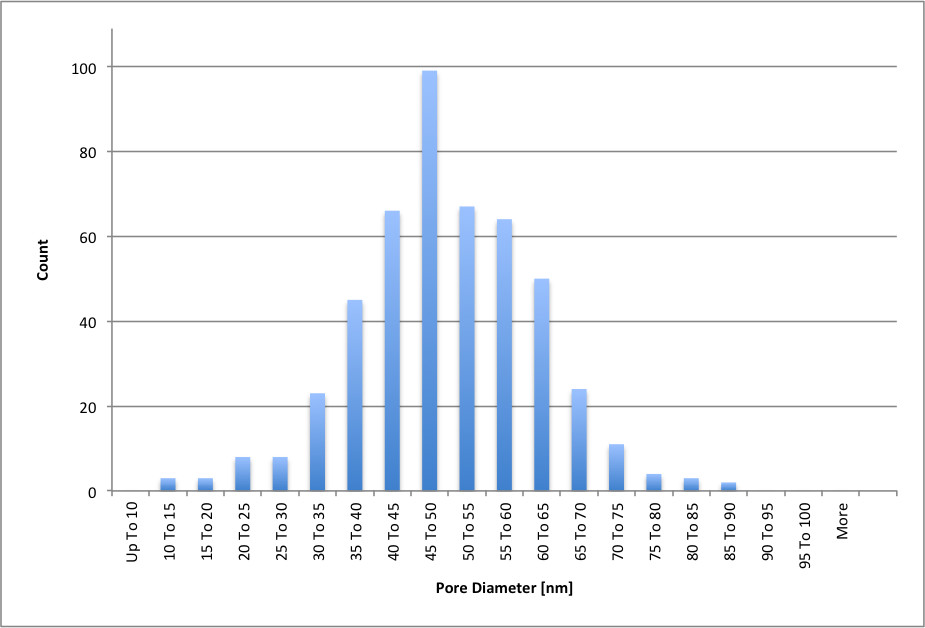
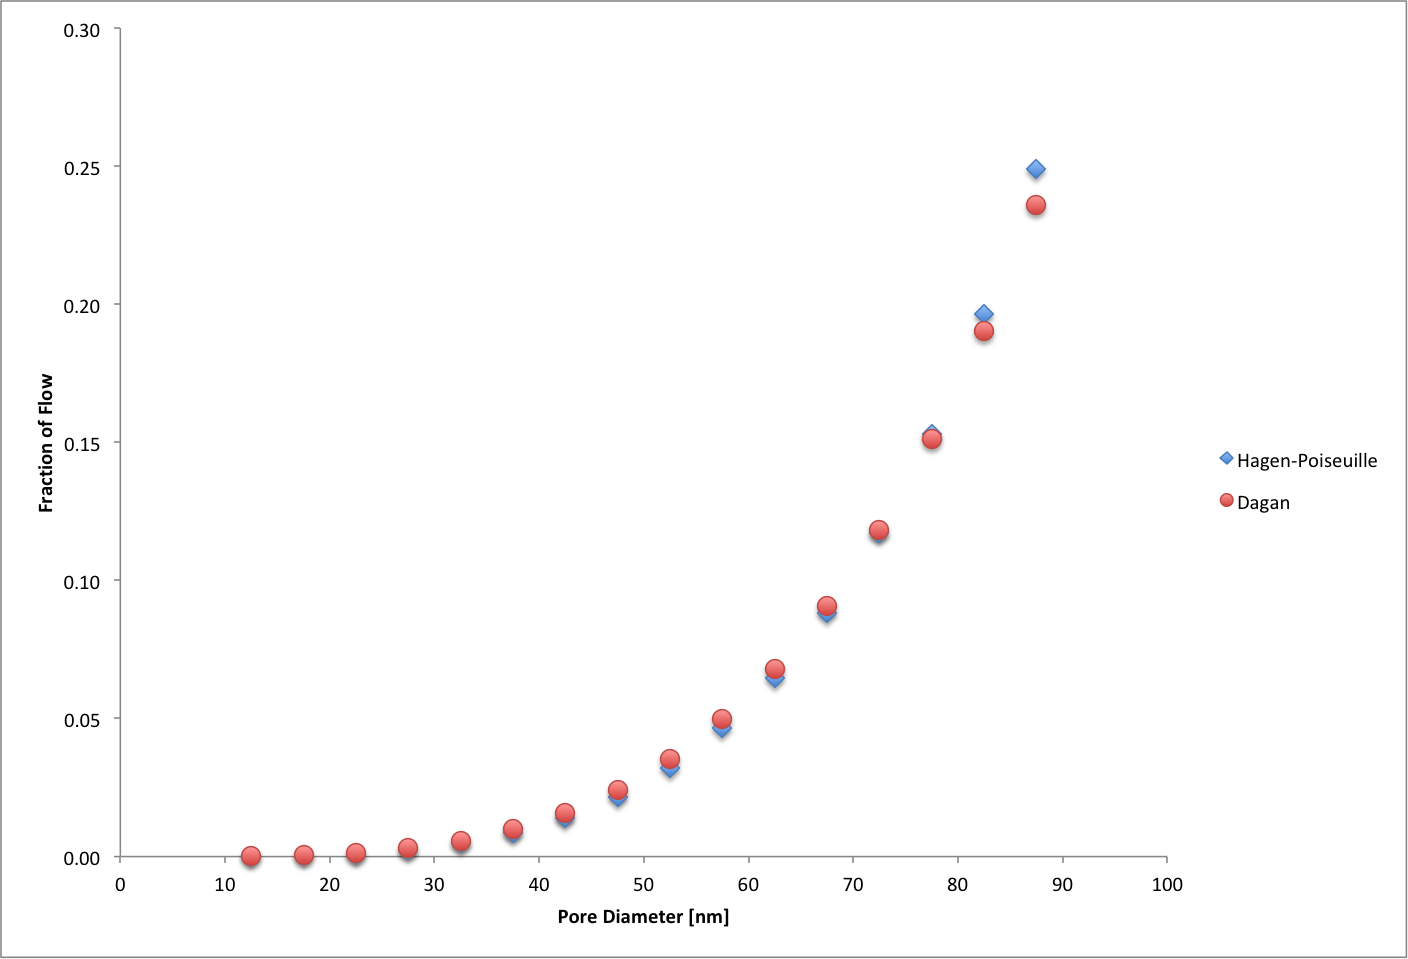
Additionally, we can look at the contribution to flow for each pore diameter over this distribution to see which size pores are the most important for flow, as analyzed with both the Hagen-Poiseuille approximation and the Dagan approximation.
For the NPN experiments, I was using chips from wafer 1255, which has an average pore diameter of 40 nm and a porosity of ~10%. The track etch membranes that Aslan brought had 80 nm pores with an average porosity of ~2%. The NPN membranes were 100 nm thick and the TE membranes were between 6-8 μm thick, which I averaged to 7 μm. I ran the NPN membranes in triplicate and then without the membrane to determine a background. The results of these experiments are as follows:
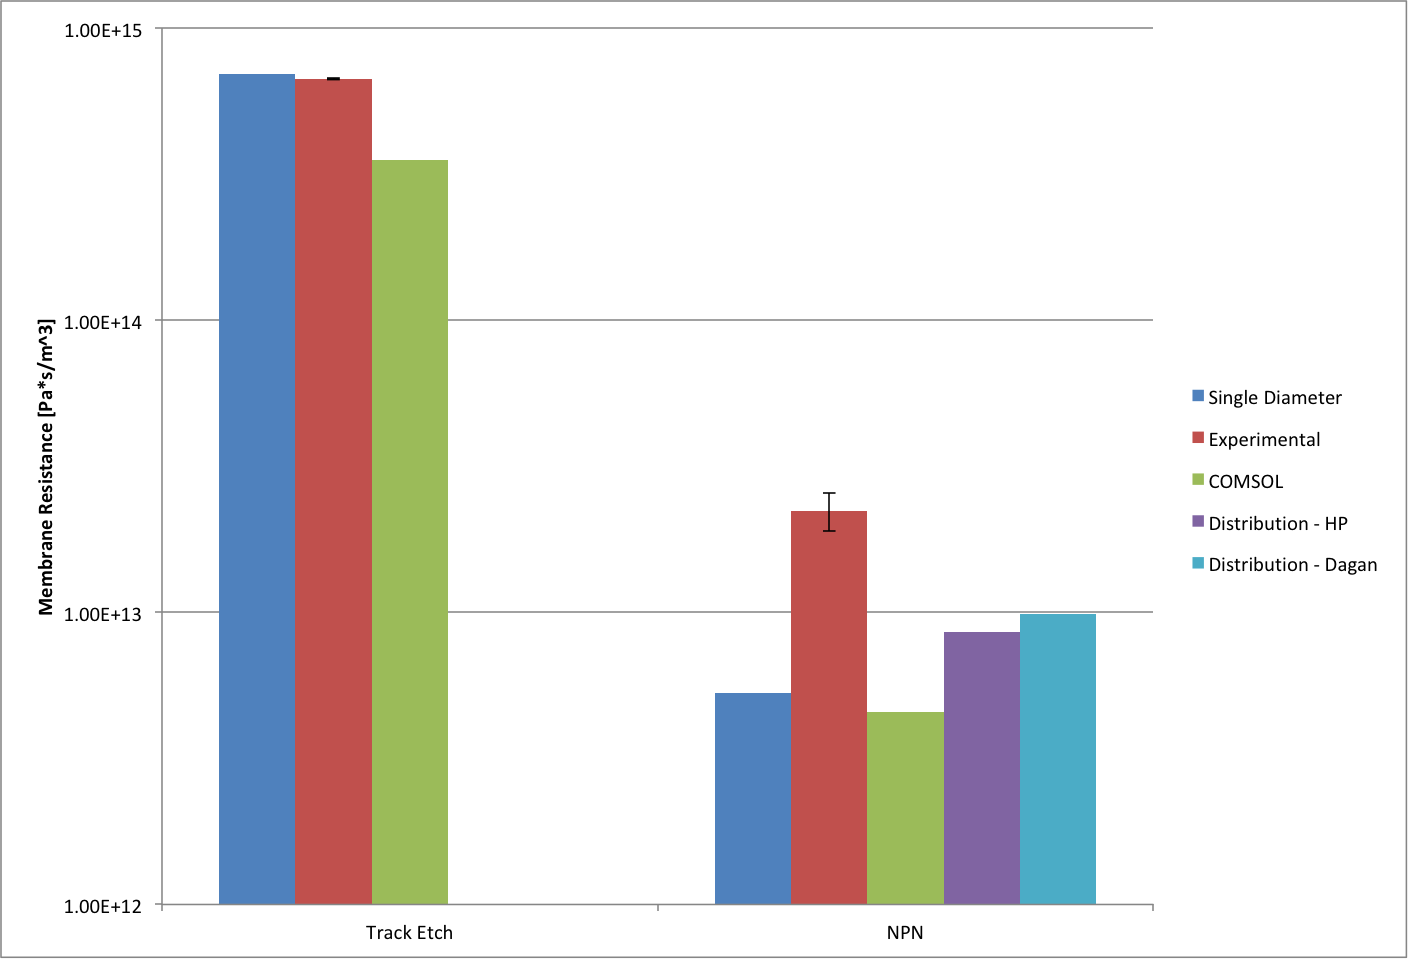
Resistance: The resistance of the membranes can be calculated from the experimental data using both the Hagen-Poiseuille model for a resistor or the Dagan model for a resistor, as mentioned above. The Dagan model is more appropriate for thin membranes and should therefore be more accurate than the Hagen-Poiseuille equation for this analysis. As we can see in the following image, The track etch membranes are similar across the single pore diameter model and the experimental data, but vary with the COMSOL data, likely due to approximations made during the simulation. The NPN data is more varied, with the experimental data giving the highest resistance, while all the models underestimate the resistance in the channel. This underestimation is likely due to factors in the device that the models do not account for. However, the background was subtracted from this data, which indicates that the models are still less accurate than what we would predict.
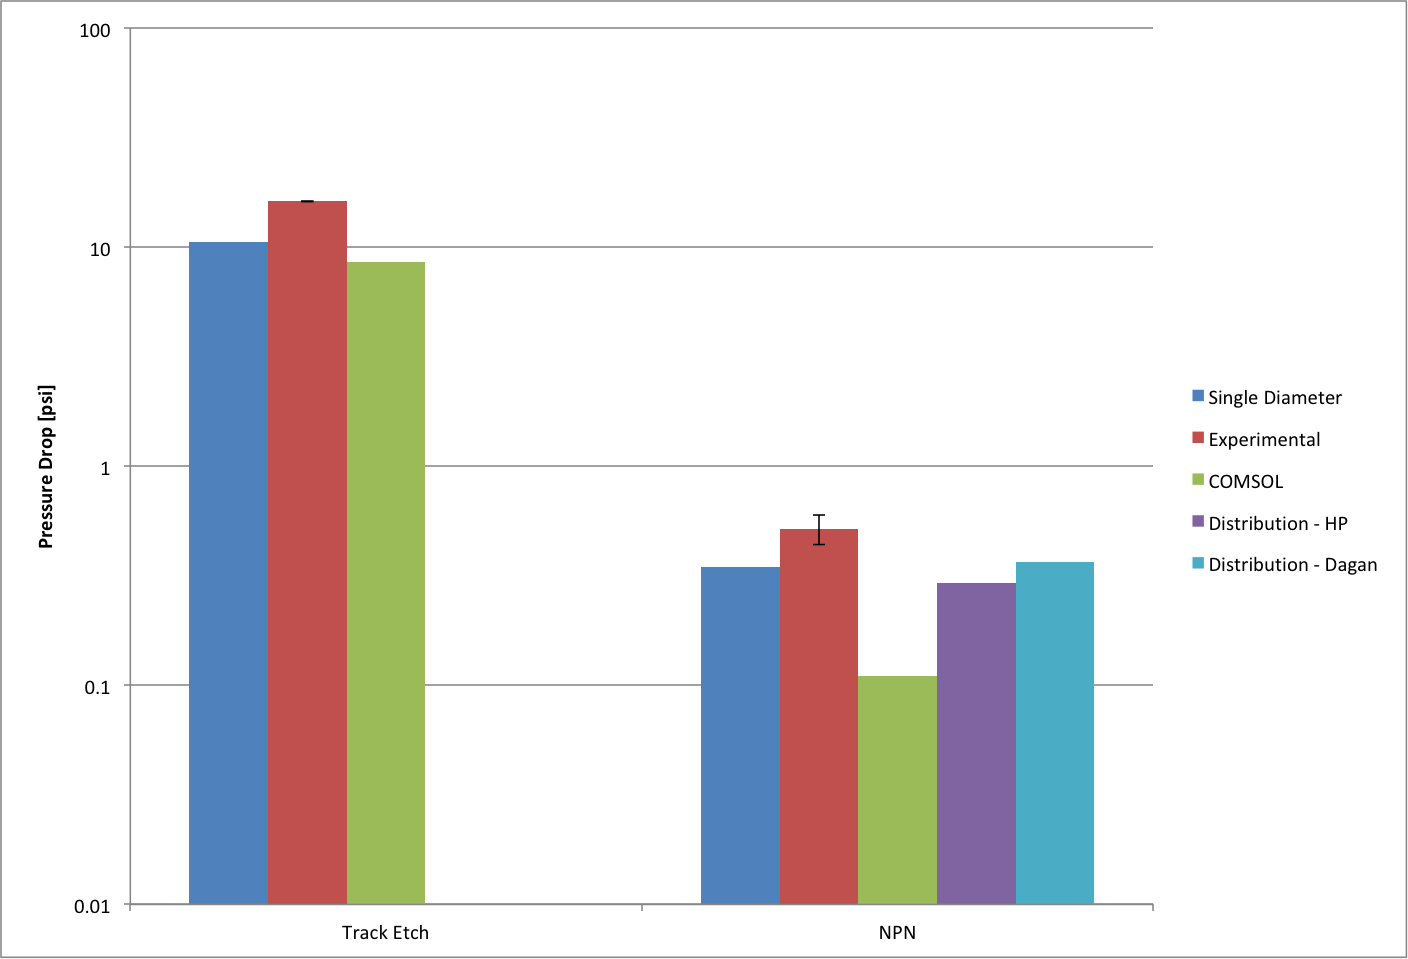
Pressure Drop: Using the LabSmith system, I directly measured the pressure drop across both track etch membranes and NPN membranes. I then compared these measured pressure drops to COMSOL and first order predictions for the pressure drop. In both systems, the models under-predicted the pressure drop across the membrane, even when taking into account a distribution of pores for NPN membranes and using the Dagan equation. However, the values are not too far from the experimental data, they just look as though they are because the data is plotted with a logarithmic y-axis so that both data sets can be compared.
Paper figure: I complied all of this data and put it into a figure that I think best describes the work to use as Figure 4 in our paper. It is as follows.
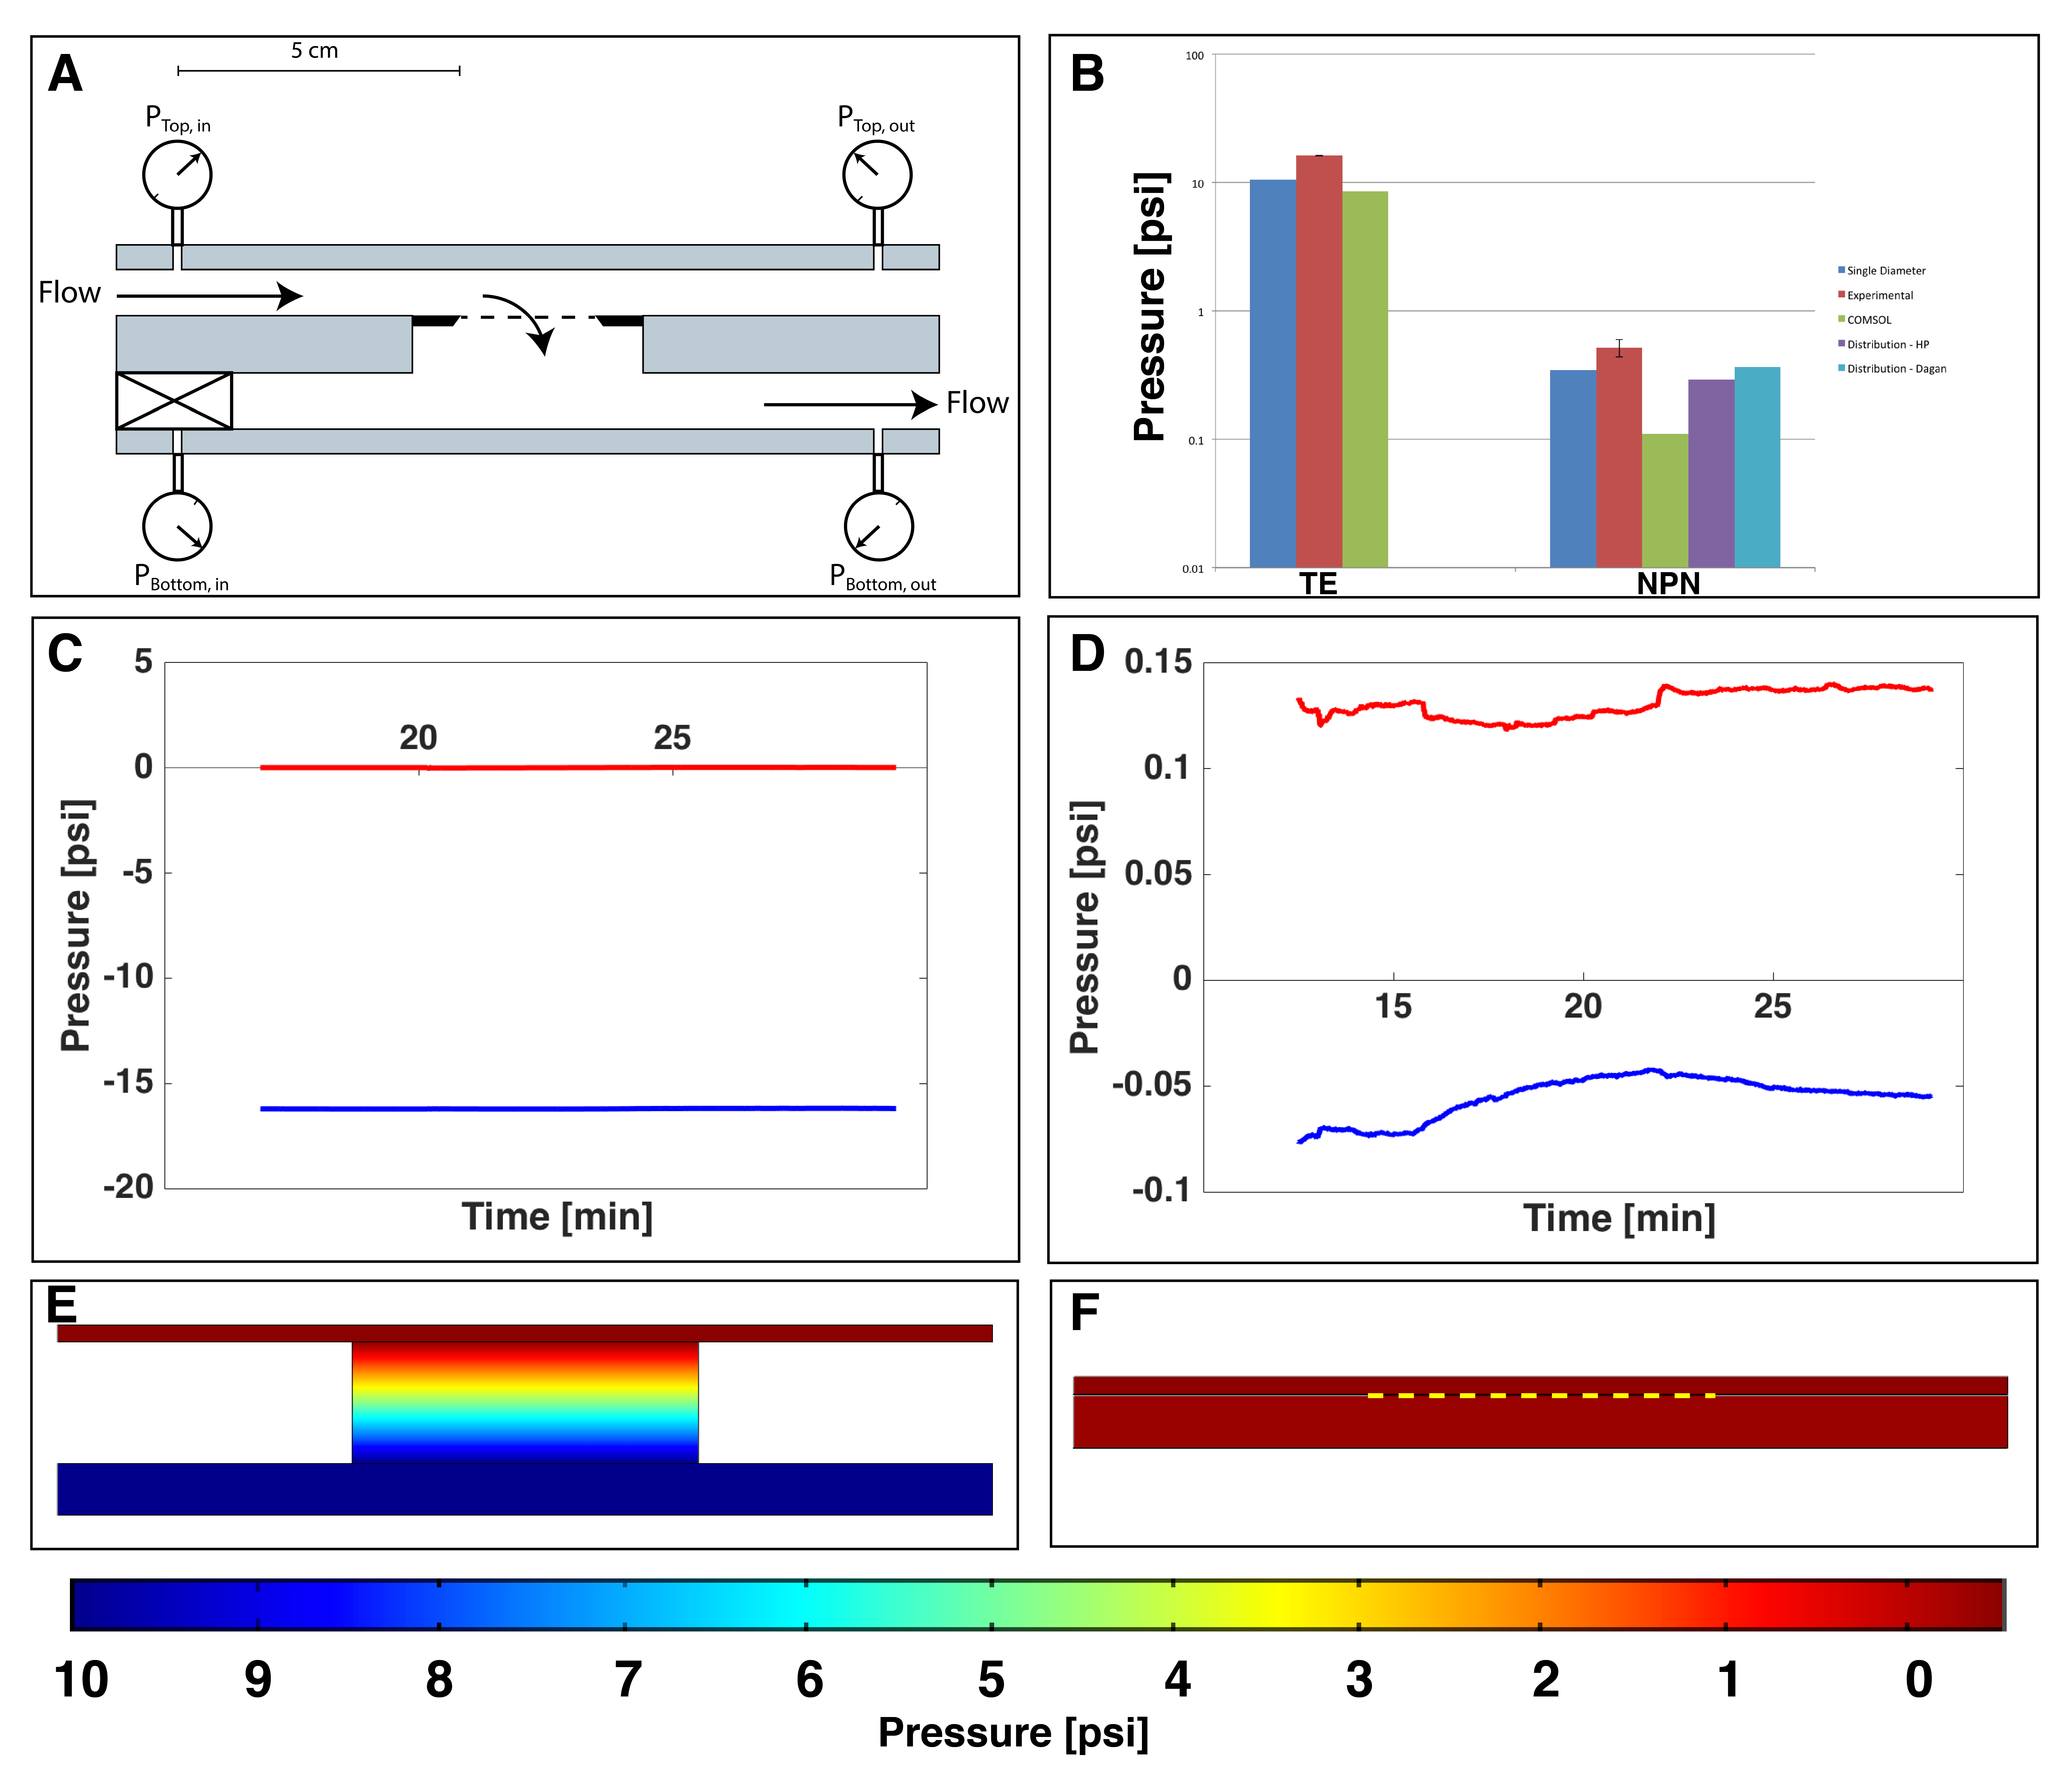
Figure 4: Experimental, theoretical and computational pressure drops across nanoporous polycarbonate track etch membranes and nanoporous silicon nitride membranes. A) Diagram of the pressure monitoring system showing the position of the pressure sensors and the direction of flow. All flow was performed at 10 μL/min through the membrane with a syringe pump pushing on the top channel and a syringe pump pulling on the bottom channel. B) Comparison of pressure drops across the track etch and NPN membranes. Blue = single pore diameter, first order prediction. Red = experimental data. Green = COMSOL result. Purple = 10-90 nm pore diameter distribution, Hagen-Poiseuille first order prediction. Cyan =10-90 nm pore diameter distribution, Dagan first order prediction. Logarithmic scale used for comparison. C) Experimentally measured pressure drop across a track etch membrane. The red line represents the top channel pressure and the blue line represents the bottom channel pressure. D) Experimentally measured pressure drop across an NPN membrane. The red line represents the top channel pressure and the blue line represents the bottom channel pressure. E) COMSOL model of pressure in a track etch system. The membrane is modeled using the Free and Porous Flow toolbox with a Darcy’s permeability calculated for this system. F) COMSOL model of pressure in an NPN system. The membrane is modeled using the Free and Porous Flow toolbox with a Darcy’s permeability calculated for this system.